Figure 8.
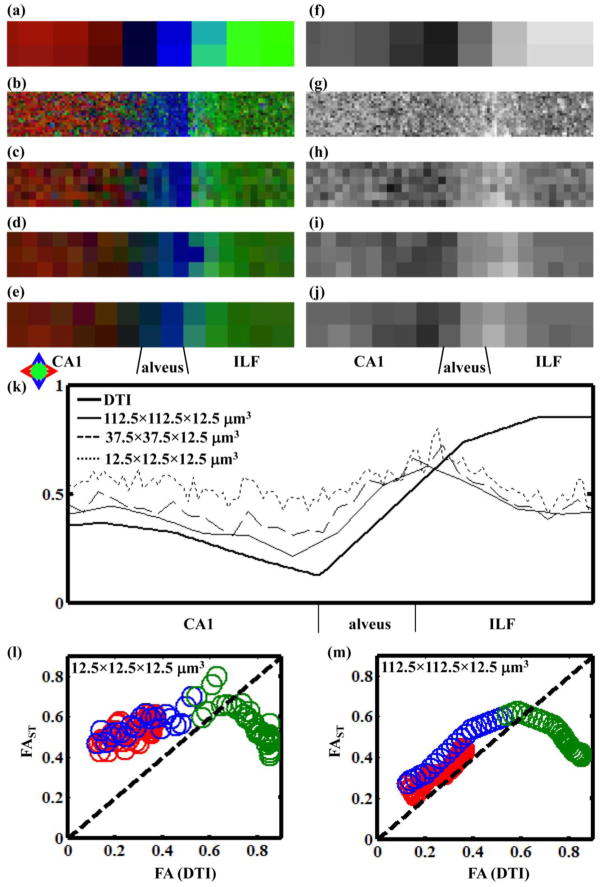
(a–e) Directional FA maps and (f–j) grayscale FA maps following DTI and 3D structure tensor analyses. FAST values were determined with neighborhood sizes of (b,g) 12.5×12.5×12.5 μm3, (c,h) 37.5×37.5×12.5 μm3, (d,i) 75×75×12.5 μm3, and (e,j) 112.5×112.5×12.5 μm3 with a Gaussian kernel width σ = 2.0 μm. (k) Average FAST values (thin lines) and FA values (thick line) are shown as a function of horizontal position in the hippocampal montage. (l) and (m) are correlation plots between FAST (ordinate) and FA (abscissa) with neighborhood size 12.5×12.5×12.5 μm in (l) and 112.5×112.5×12.5 μm (m).

