
Figure 3.
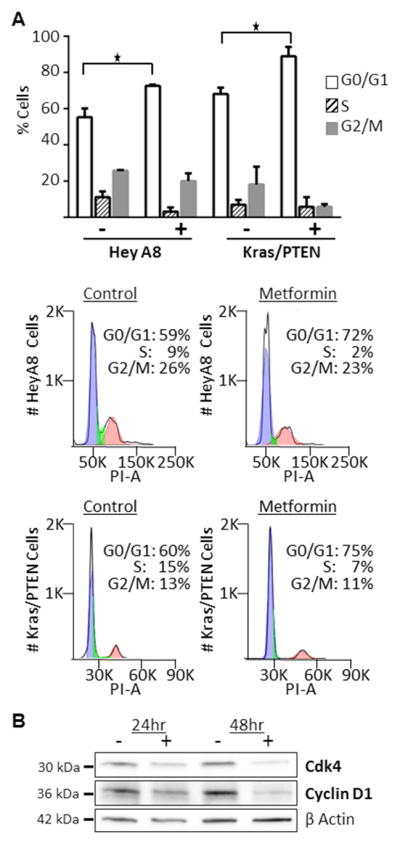
Cell cycle arrest with metformin treatment. (A) Cell cycle analysis. K-ras/PTEN and HeyA8 cells were serum-starved for 24 hours before treating with 20 mM metformin for 24 hours. Cells were then stained with propidium iodine and analyzed using flow cytometry. Columns, mean percent of cells in each phase of cell cycle; *, P<0.5. Histograms from each cell line are shown. Blue: G0/G1 phase, green: S phase, red: G2/M phase. (B) Western blots. Protein expression of Cdk4 and cyclin D1. The SKOV3ip1 ovarian cancer cell line was treated with 40 mM metformin or vehicle in serum free media for the indicated times.