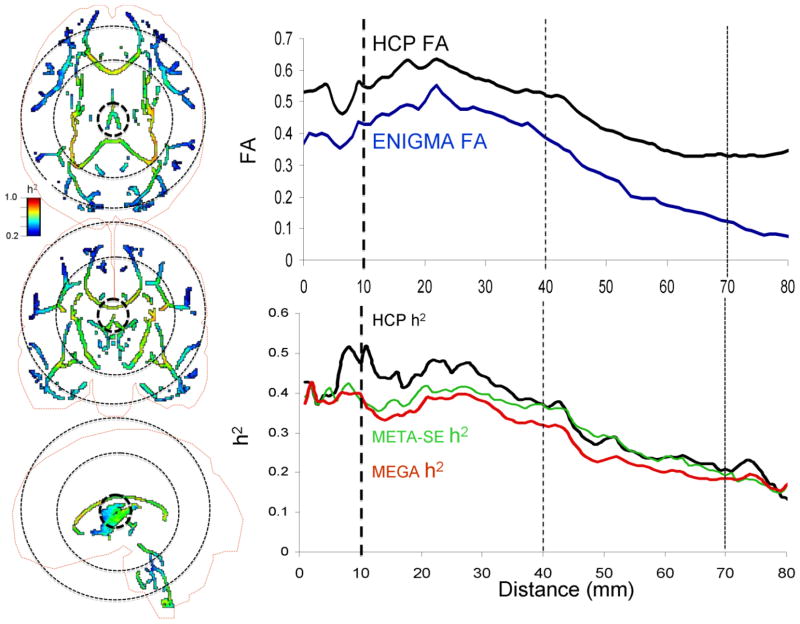
Figure 7.
Left panels: Voxel-wise heritability (h2) values for HCP sample shown on the ENIGMA-DTI skeleton with the cortical outline (axial, coronal, and sagittal views). Right panels: voxel-wise FA and h2 plotted versus the distance from the center of the MNI space. The dotted circles (left panel) and lines (right panel) represent distance of 10, 40 and 70 mm from the center of the MNI space. The FA values were significantly higher (p<0.001) for both proximal (10–40 mm) and distal (40–70 mm) voxels in HCP vs. ENIGMA sample. HCP heritability values were significantly higher for proximal (p=0.001) but not distal voxels (p=0.32) (bottom row, right column).

