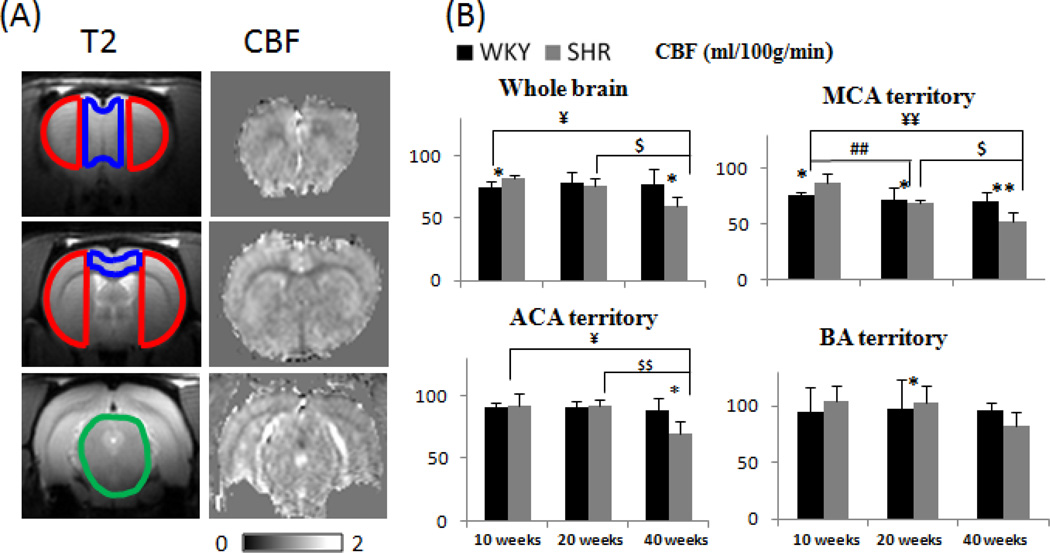
Figure 5.
(A) Anatomical images of a WKY rat with ROI overlaid of the BA territory (green), MCA territory (red), ACA territory (green) and basal CBF images for 3 image slices of the 40-week WKY. Scale bar: 0–200ml/100/min. (B) Group-averaged CBF of the whole brain, MCA, first branch of the MCA and AA in WKY and SHR animals at different time points. Error bars are ±SEM for N=6~16 for each group. *, $, ¥ p<.05, and **, $$ p<0.01.

