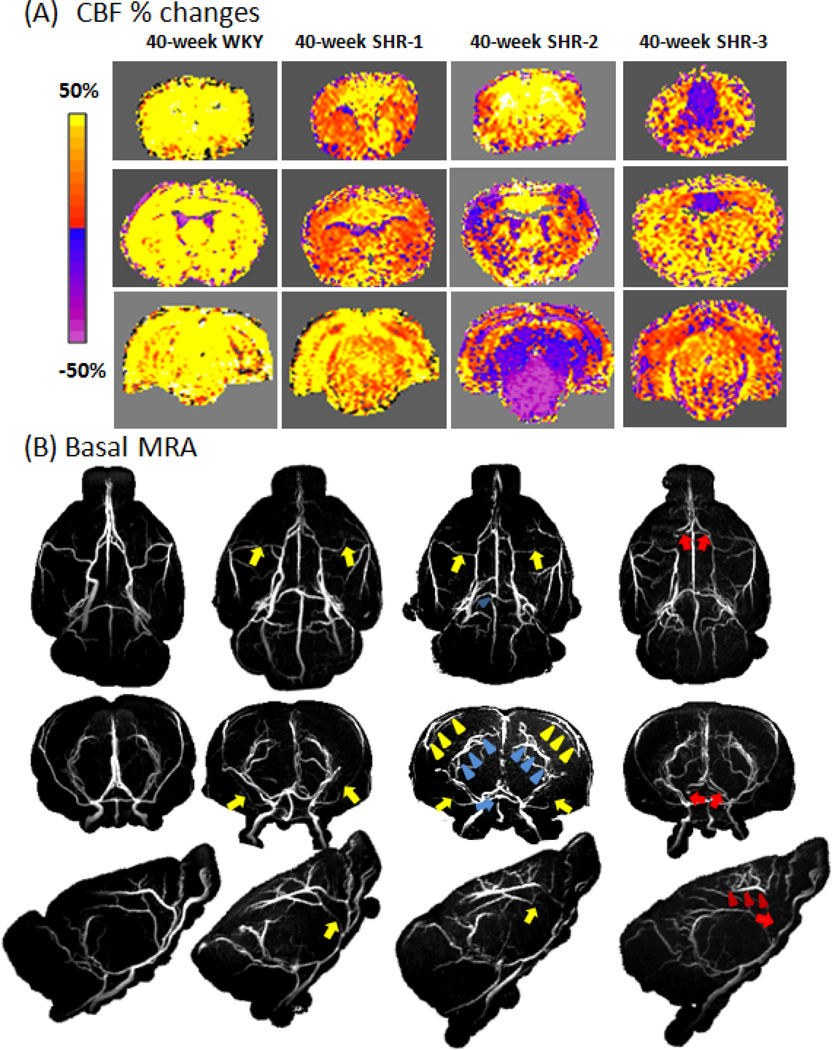
Figure 6.
(A) CBF percent-change maps responding to 5% CO2 for a WKY and three different SHR all at 40 weeks. The overlaid ROIs are the BA territory (green), MCA territory (red), ACA territory (green). Scale bar: −80% to 80%. (B) The corresponding MRA from WKY and SHR. Stenosis was found in the ACA (red arrows), MCA (yellow arrows) and BA (blue arrows). Enhanced MRA signal in the pial arterioles of ACA (red arrowheads), MCA (yellow arrowheads) and PCA (blue arrowheads) was observed.

