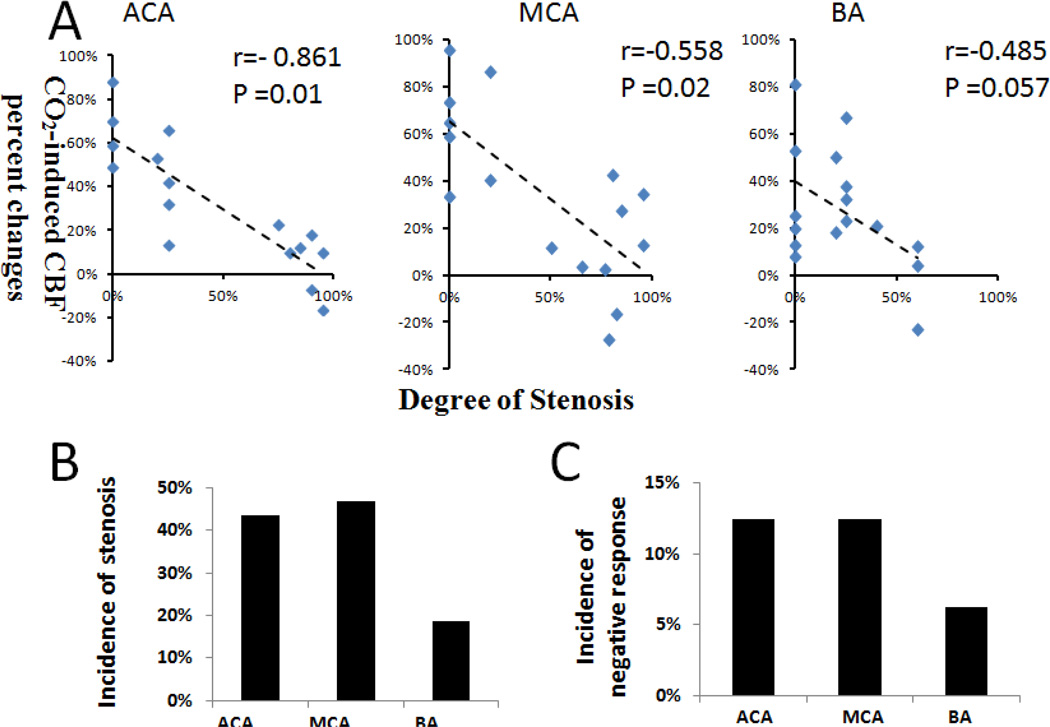
Figure 7.
(A) Hypercapnic CBF responses versus degree of stenosis for the ACA, MCA BA for 40-week SHR (n = 16). The hypercapnic CBF responses were obtained from the corresponding perfusion territories of these vessels. The correlation coefficients were −0.718, −0.417 and −0.485 (p value = 0.02, 0.11, and 0.057), respectively. (B) The incidence of negative hypercapnic CBF response and the incidence of stenosis in the ACA, MCA and BA of 40-week SHR (n = 16).

