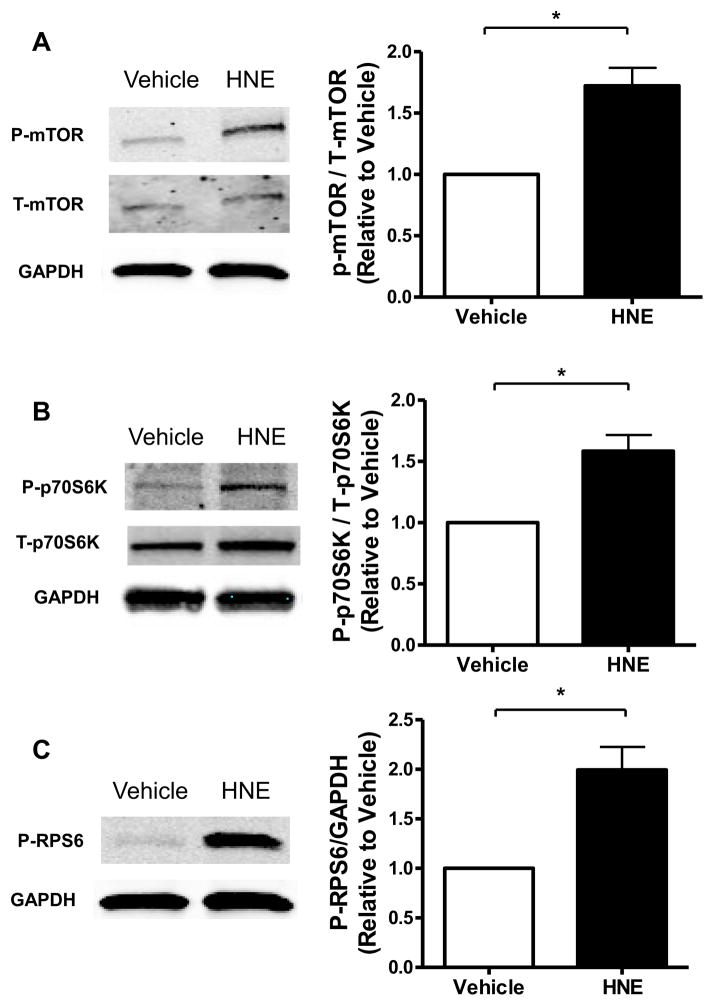
Figure 3. Hypertrophic mTOR-P70S6K and RPS6 phosphorylation are induced by HNE.
(A) Levels of phosphorylated mTOR (P-mTOR) were quantified by densitometry and normalized to total mTOR (T-mTOR) and GAPDH (n=3). (B) Levels of phosphorylated p70S6K (P-p70S6K) were quantified by densitometry and normalized to total p70S6K (T-p70S6K) and GAPDH (n=3). (C) Levels of phosphorylated RPS6 (P-RPS6) were quantified by densitometry and normalized to GAPDH (n=4). For all of these experiments each replicate is an independent experiment conducted in duplicate using cells obtained from separate preparations of ARVMs, * = p < 0.05, and error bars are mean ± standard error.

