
Figure 1. Number of SNPs discovered in samples is independent of sequencing depth.
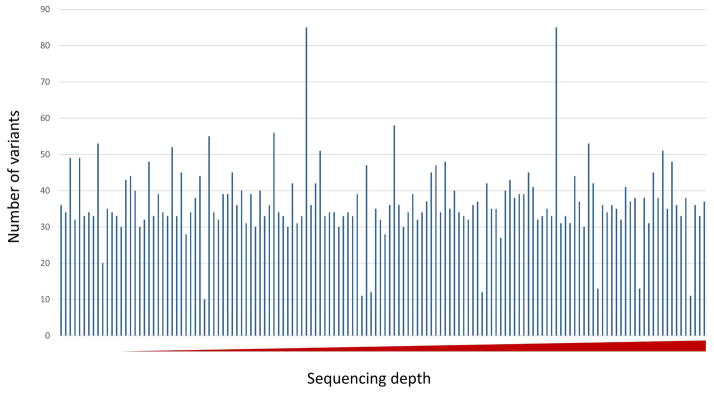
The X axis shows the sequencing depth from low to high (min 20, max 171). The Y axis depicts the number of SNPs discovered per subject sample.
Official websites use .gov
A
.gov website belongs to an official
government organization in the United States.
Secure .gov websites use HTTPS
A lock (
) or https:// means you've safely
connected to the .gov website. Share sensitive
information only on official, secure websites.
The X axis shows the sequencing depth from low to high (min 20, max 171). The Y axis depicts the number of SNPs discovered per subject sample.