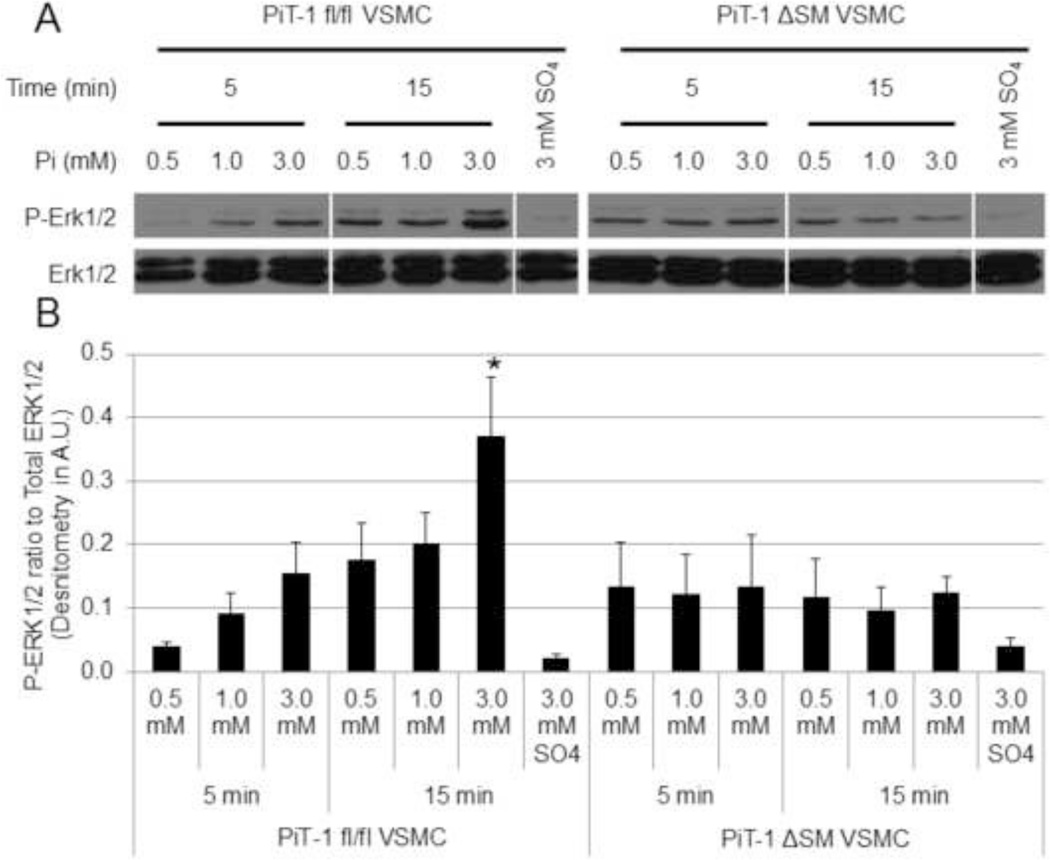
Figure 2. PiT-1 is required for Pi-induced ERK1/2 phosphorylation in VSMCs.
(A) Pi induction of p-ERK1/2 and total ERK1/2 were visualized by Western blot analysis by incubating PiT-1 fl/fl and PiT-1 ΔSM VSMCs in 0.5 mM Pi, 1.0 mM Pi, 3.0 mM Pi, or 3.0 mM Sodium sulfate for 5 or 15 minutes. (B) Densitometry was used to quantify the immunoblot images and shown as the ratio of P-ERK1/2 to Total ERK1/2. Western blot is representative of three experiments with similar results, and quantification is represented as mean ± S.D., n = 3 for all data points. Statistically significant differences from all other data from the same cell line is indicated by * = P<0.05 as measured by One-way ANOVA post-hoc Tukey analysis.

