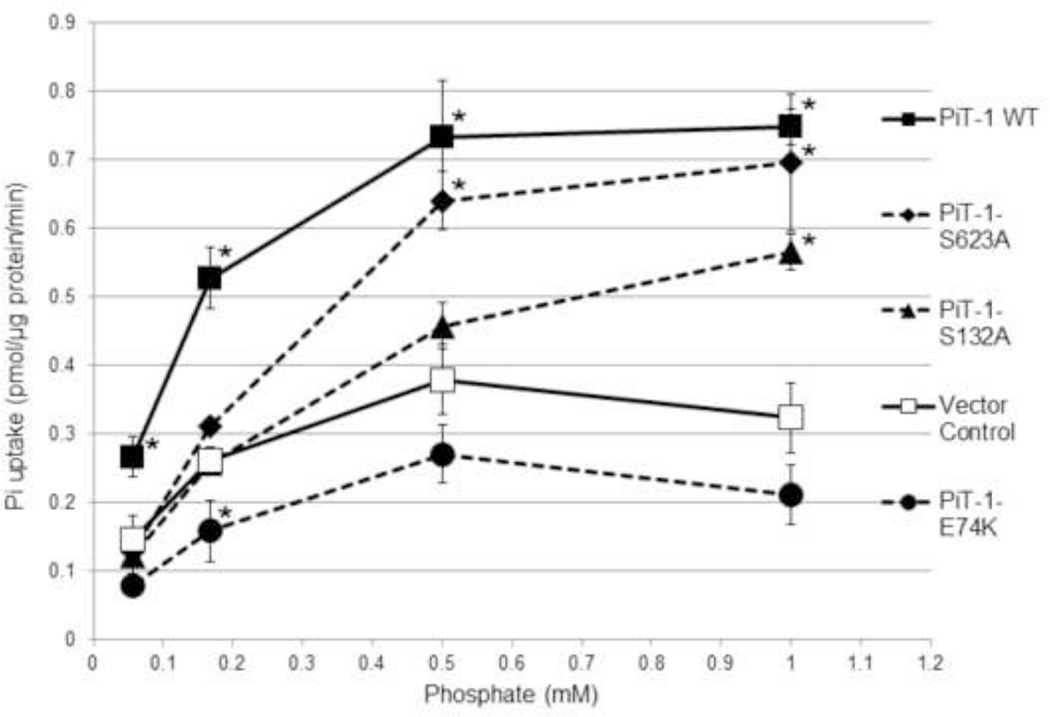
Figure 4. PiT-1 point mutations impair sodium-dependent Pi uptake in VSMCs.
Sodium-dependent Pi uptake was quantified over a range of Pi concentrations in VSMCs expressing vector control, PiT-1 WT, PiT-1-E74K, PiT-1-S132A, or PiT-1-S623A. VSMC Pi uptake was measured over 20 minutes and normalized to time and VSMC protein content. Dashed connecting lines signify PiT-1 point mutation constructs. Data presented as mean ± S.D., n = 3 for all data points. Statistically significant differences between Vector Control and each PiT-1 construct at the same Pi concentration are indicated by * = P<0.05 as measured by One-way ANOVA post-hoc Tukey analysis.

