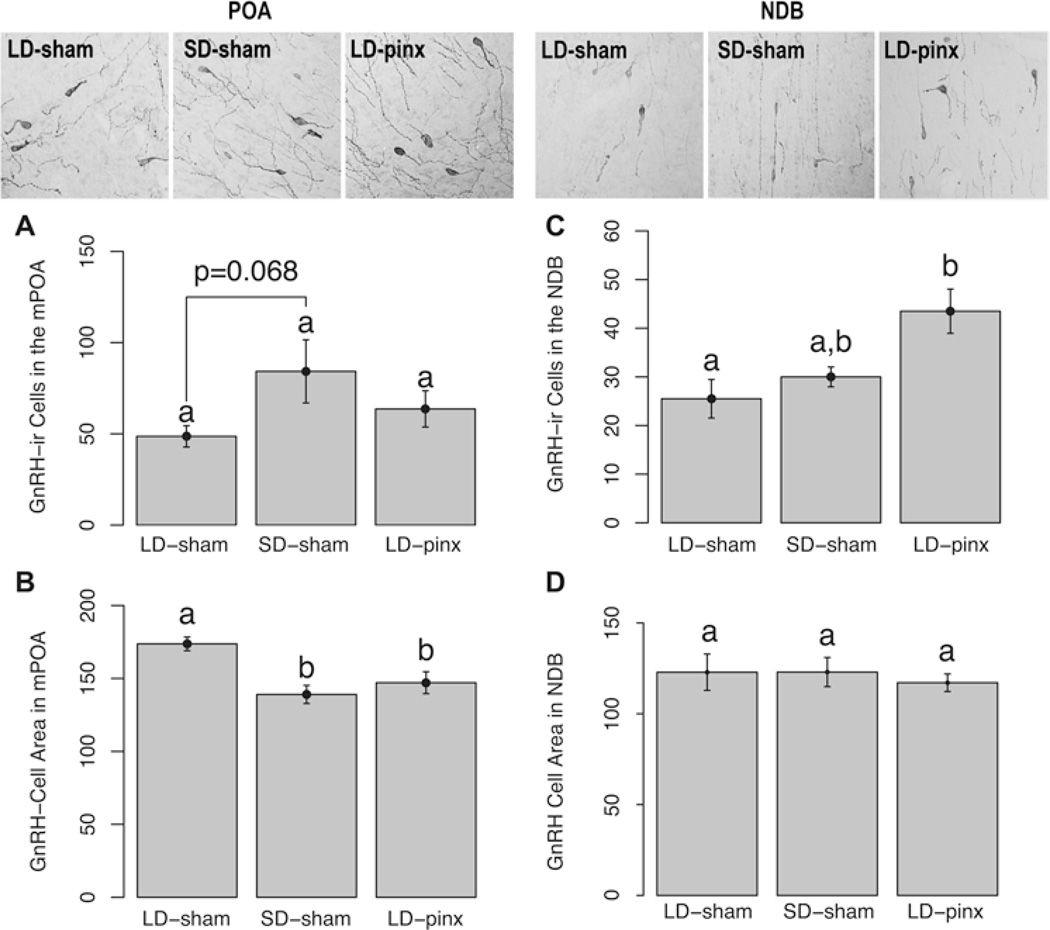
Figure 2.
Mean ± SEM GnRH-ir cell numbers in the (A) mPOA and (C) NDB and GnRH-ir cell areas in the (B) mPOA and (D) NDB. Representative photomicrographs of GnRH-ir cells are above each bar. LD-sham hamsters displayed a trend toward fewer GnRH cells in the mPOA compared to SD-sham but not LD-pinx hamsters. LD-sham hamsters exhibited a larger cell area in the mPOA than either SD-sham or LD-pinx hamsters. LD-sham hamsters displayed a lower number of immunoreactive cells in the NDB than did LD-pinx hamsters, but SD-sham hamsters did not differ from either group. Letters different from each other denote significant differences (p < 0.05).

