Figure 3.
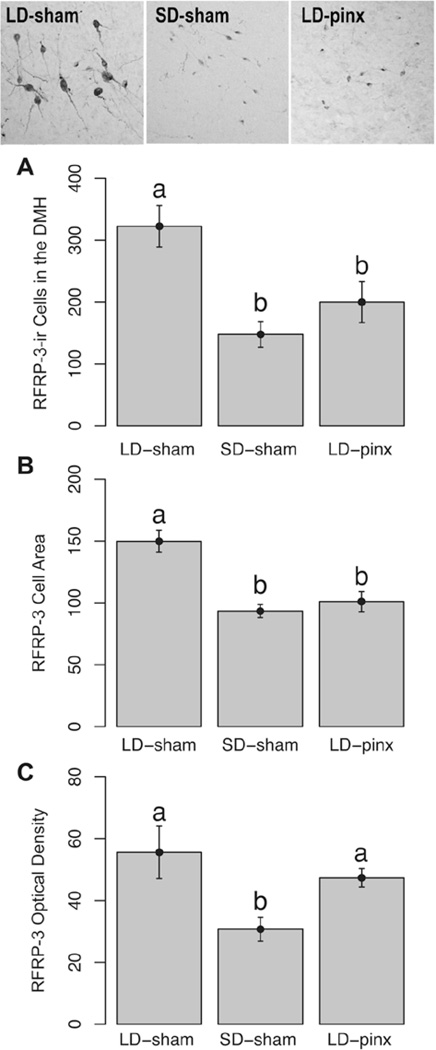
Mean ± SEM (A) number of RFRP-3-ir cells (B) area of RFRP-3-ir cells and (C) optical density of RFRP-3-ir cells in the DMH. Representative photomicrographs of RFRP-3-ir cells are at the top of the figure. LD-sham hamsters had significantly more RFRP-3-ir cells and a larger cell area than both the SD-sham and LD-pinx hamsters. LD-sham hamsters also had a significantly higher optical density than SD-sham but not LD-pinx hamsters. Letters different from each other denote significant differences (p < 0.05).

