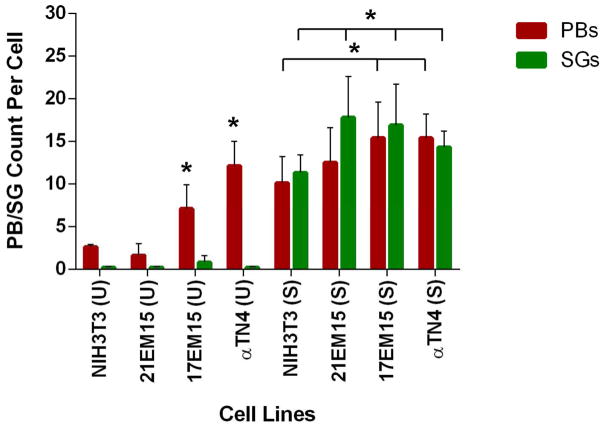
Figure 7. Lens epithelial cell lines exhibit elevated numbers of Processing bodies or Stress granules in comparison to NIH3T3 cells.
Processing bodies (P-bodies) and Stress granules (SGs) were counted under normal (un-stress, U) and stress (S) conditions for all four cell lines. Average numbers of P-bodies and SGs per cell under both unstressed and stressed conditions are shown in the graph. Horizontal bar between cell lines denotes p-values < 0.05 for PB or SG counts per cell. In un-stress or stress conditions, αTN4 and 17EM15 cells exhibit significantly higher numbers of P-bodies in comparison to the NIH3T3 cell line. In conditions of stress, all three LECs exhibit significantly higher numbers of SGs compared to NIH3T3 cells. Asterisk denotes p-values < 0.05.

