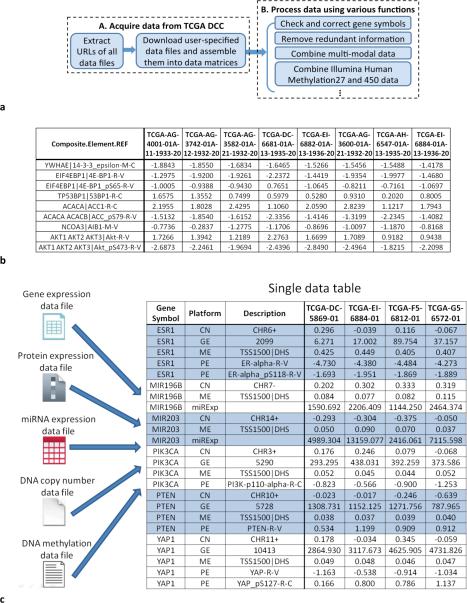
Figure 1.
TCGA-Assembler as a tool for acquiring, assembling, and processing public TCGA data. (a) Flowchart of TCGA- Assembler. Module A acquires data from TCGA DCC. Module B processes the obtained data using various functions. (b) Illustration of a data matrix file using protein expressions generated by Reverse Phase Protein Array (RPPA). Each row corresponds to a protein or phosphorylated protein, and each column corresponds to a sample. The first column shows the gene symbol (before “|”) and the name of the protein antibody (after “|”) used in RPPA. (c) Illustration of combining multi- modal data. After combination, a single mega data table is obtained, in which each column (except the first three columns) corresponds to a patient sample and each row corresponds to a genomic/epigenomic feature. All multi-modal data of a gene are adjacent in the table and are indicated by alternating blue/white color. In the second column, GE represents gene expression, PE protein expression, ME DNA methylation, CN copy number, and miRExp miRNA expression. In the third column, the description of GE platform is the Entrez ID of gene; the description of PE platform is the name of the protein antibody used in RPPA assay; “TSS1500|DNS” for the description of ME platform indicates that the values are average methylation measurements of CpG sites that are within 1,500 nucleotide base pairs of transcription start site and are DNAse hypersensitive; the description of CN platform gives the chromosome ID and strand of a gene.

