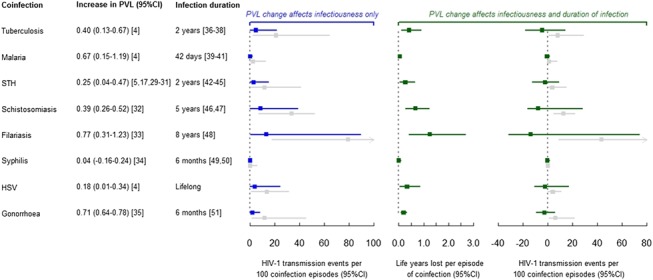
FIGURE 2.

Estimated impact of coinfections on duration of HIV-1 infection and onward HIV-1 transmission. Points represent medians and error bars represent 2.5th and 97.5th percentiles of output from 10,000 simulated individuals. Calculations assume that each coinfection is acquired halfway through the HIV-1 asymptomatic period. Plot in blue shows results under the assumption that changes in PVL only affect HIV-1 infectiousness. Plots in green show results under the assumption that changes in PVL change duration of infectiousness (middle plot of change in life-years) and infectiousness (right-hand plot). Therefore, there is impact in terms of both transmission and life-years gained (preceding initiating ART). Change in HIV-1 transmission events plots additionally show results using the Quinn et al2 PVL-infectiousness relationship (results shown in gray). STH, soil-transmitted helminths (excluding schistosomiasis).
