
Figure 2.
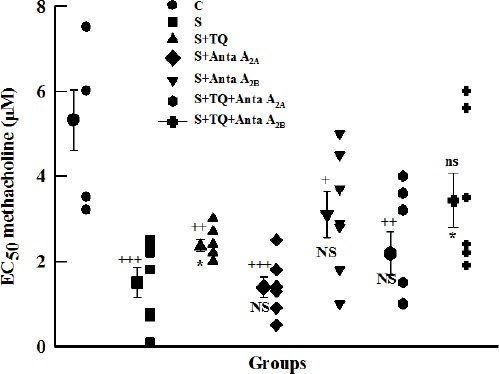
Individual values and mean±SEM (big symbols with bars) of tracheal response to methacholine (EC50) in control (C), sensitized (S), sensitized pretreated with thymoquinone (S+TQ), sensitized pretreated with selective A2A antagonist (ZM241385) and selective A2B antagonist (MRS1706) (S+Anta A2A and S+Anta A2B), sensitized groups pretreated with selective A2A antagonist and thymoquinone (S+Anta A2A+TQ) and selective A2B antagonist and thymoquinone (S+Anta A2B+TQ) (for each group, n=7). Statistical differences between control and different groups: ns: non significant differences, +; P<0.05, ++; P<0.01, +++; P<0.001. Statistical differences between pretreated groups vs sensitized group: NS: non significant differences, *: P<0.05