
Figure 6.
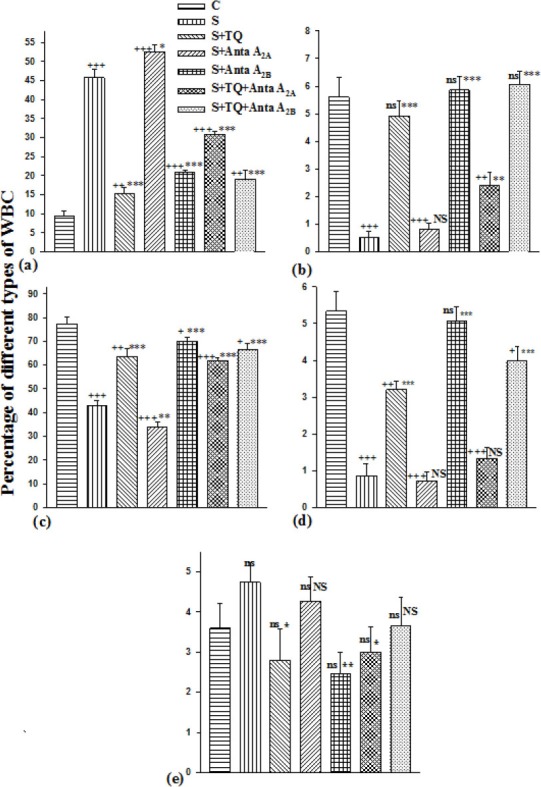
The percentages of eosinophil (a), neutrophil (b), lymphocyte (c), monocyte (d) and basophil (e) of lung lavage fluid in control, sensitized (S), sensitized pretreated with thymoquinone (S+TQ), sensitized pretreated with selective A2A antagonist (ZM241385) and selective A2B antagonist (MRS1706) (S+Anta A2A and S+Anta A2B), sensitized groups pretreated with selective A2A antagonist and thymoquinone (S+Anta A2A+TQ) and selective A2B antagonist and thymoquinone (S+Anta A2B+TQ) guinea pigs (for each group, n=15). Statistical differences between control and different groups: ns; non significant differences, +; P<0.05, ++; P<0.01, +++; P<0.001. Statistical differences between pretreated groups vs sensitized group: NS; non significant differences,*: P<0.05, **; P<0.01, ***: P<0.001