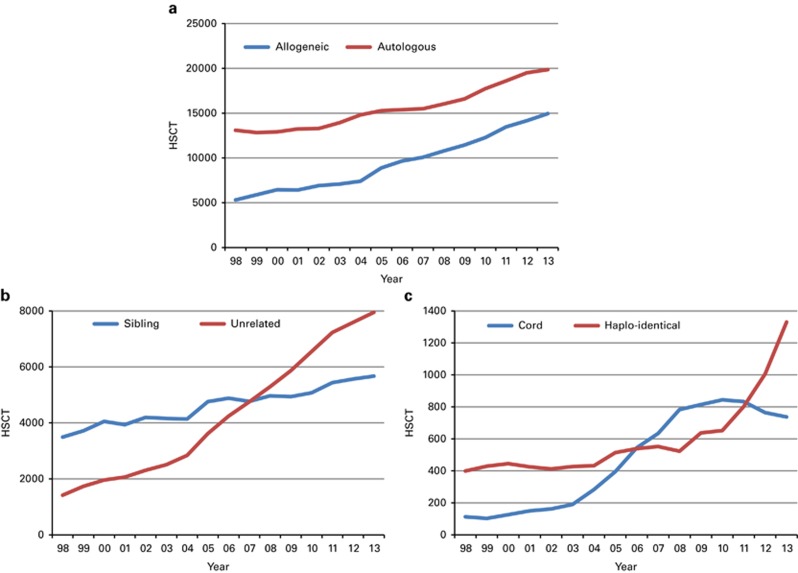
Figure 3.
Absolute numbers by transplant and donor type 1998–2013. (a) Absolute numbers of allogeneic and autologous HSCT in Europe in 1998–2013. (b) Absolute numbers of sibling donor and unrelated donor HSCT in Europe 1998–2013. (c) Absolute numbers of haploidentical and cord blood HSCT in Europe 1998–2013.

