
Fig. 2. .
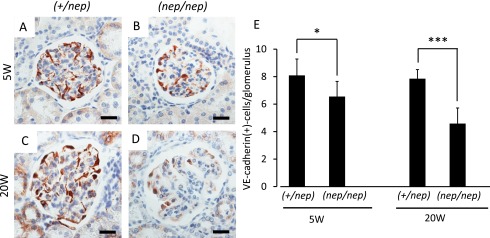
Immunohistochemical images of VE-cadherin at 5 and 20 weeks of age. (A) 5W of heterozygotes, (B) 5W of homozygotes, (C) 20W of heterozygotes, (D) 20W of homozygotes. (E) Quantification of VE-cadherin-positive cells per glomerulus. All data are expressed as mean ± SD (n=6). Statistical analysis: *p < 0.05, ***p < 0.001 as compared with age-matched heterozygous mice. Bars=20 μm.