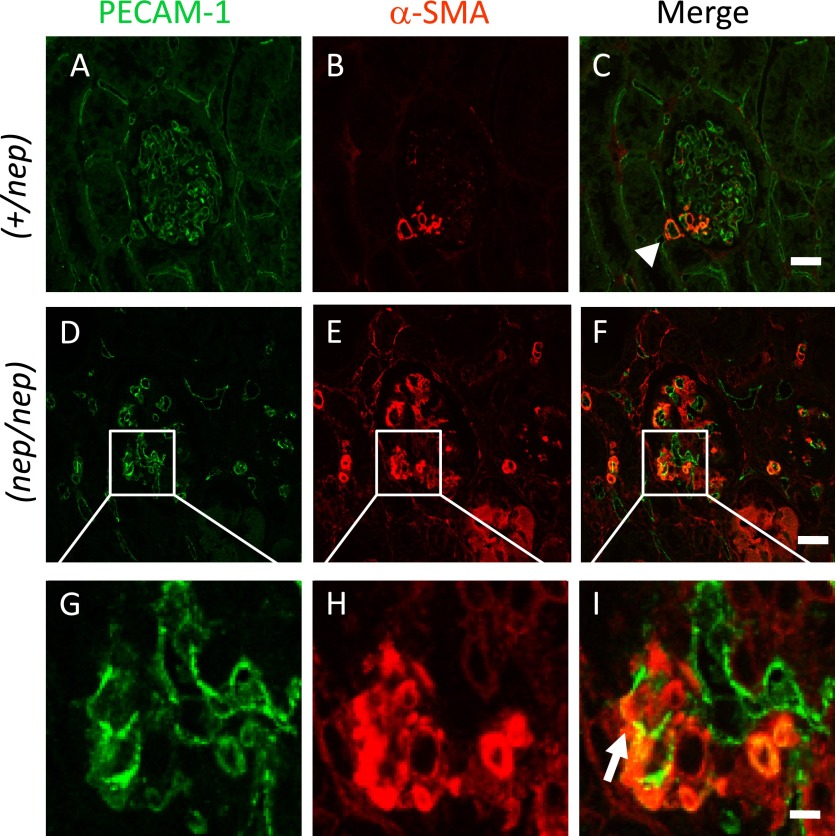
Fig. 4. .
Fluorescence images of PECAM-1 (green) and α-SMA (red) in the heterozygotes (A–C) and homozygotes (D–I) at 20 weeks of age. Bars=20 μm (A–F), 5 μm (G–I). Note: Very few populations of glomerular ECs seem to acquire mesenchyme-like phenotype (arrowhead), while EndoMT becomes evident in the glomerulus of nephrotic mice (arrow).

