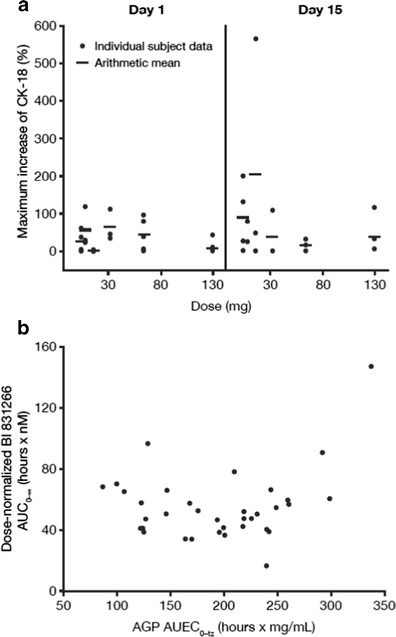
Fig. 3.

a Individual and mean maximum percentage increase in caspase-cleaved CK-18 plasma concentrations from baseline after the first 2 infusions of BI 831266. b Individual dose-normalized BI 831266 AUC0-∞ versus AGP AUEC0-tz, excluding abnormal PK profiles. CK-18 cytokeratin-18, AGP alpha-1-acid glycoprotein, AUC 0-∞ area under the plasma concentration–time curve over the time interval from 0 extrapolated to infinity, AUEC 0-tz area under the effect curve to the last evaluable timepoint, PK pharmacokinetic
