
Figure 1.
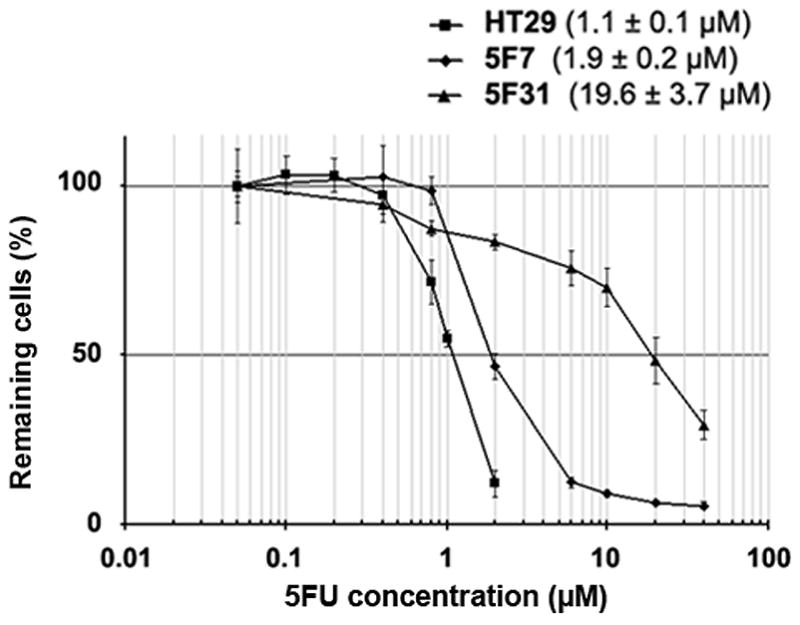
5FU-resistance of 5F7 and 5F31 cells. Survival curves of 5FU-resistant 5F7 and 5F31 clones after subsequent exposure to 5FU concentrations for 5 days. The IC50 was defined as the concentration of 5FU producing a 50% decrease in the number of cells compared with untreated controls. Error bars represent the mean±SD for six replicates.