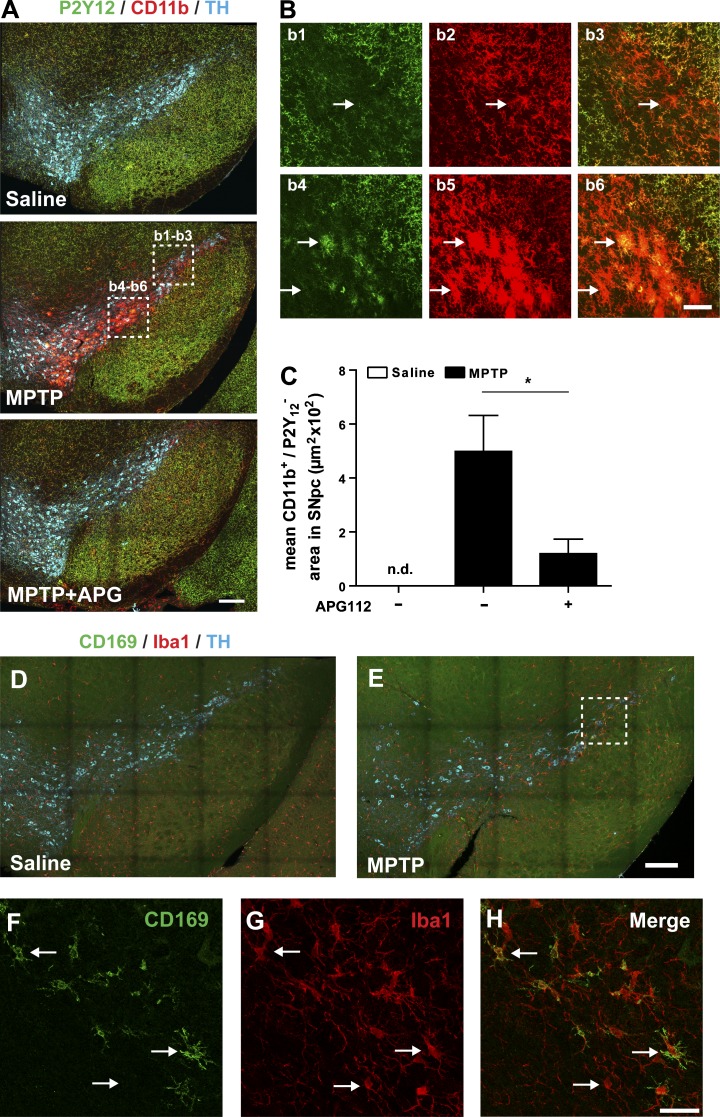
Figure 5.
Myeloid cell infiltration in SNpc demonstrated by staining of microglia marker P2Y12 or monocyte marker CD169. (A) Representative photomicrographs of SNpc sections immunostained with anti-P2Y12, anti-TH, and anti-CD11b from saline-, MPTP-, and MPTP + APG112–treated mice. (B) Representative CD11b single-positive (CD11b+/P2Y12−; as indicated with arrows in b1–b3) and CD11b P2Y12 double-positive (CD11b+/P2Y12+; as indicated with arrows in b4–b6) cells, which are highlighted with dashed rectangles in A. (C) Mosaic acquisition of CD11b single-positive (CD11b+/P2Y12−) area in saline-, MPTP-, and MPTP/APG112-treated mice. Data are presented as mean ± SEM; n = 10. Student’s t test: *, P < 0.05; n.d., not detectable. (D and E) Representative photomicrographs of SNpc sections immunostained with anti-CD169, anti-Iba1, and anti-TH from saline- and MPTP-treated mice. Infiltrating monocytes are CD169+/Iba1+ cells and microglia are CD169−/Iba1+ cells, as arrows indicate in F–H (dashed rectangle in E). Bars: (A, D, and E) 100 µm; (B) 30 µm; (F–H) 20 µm.

