Figure 6.
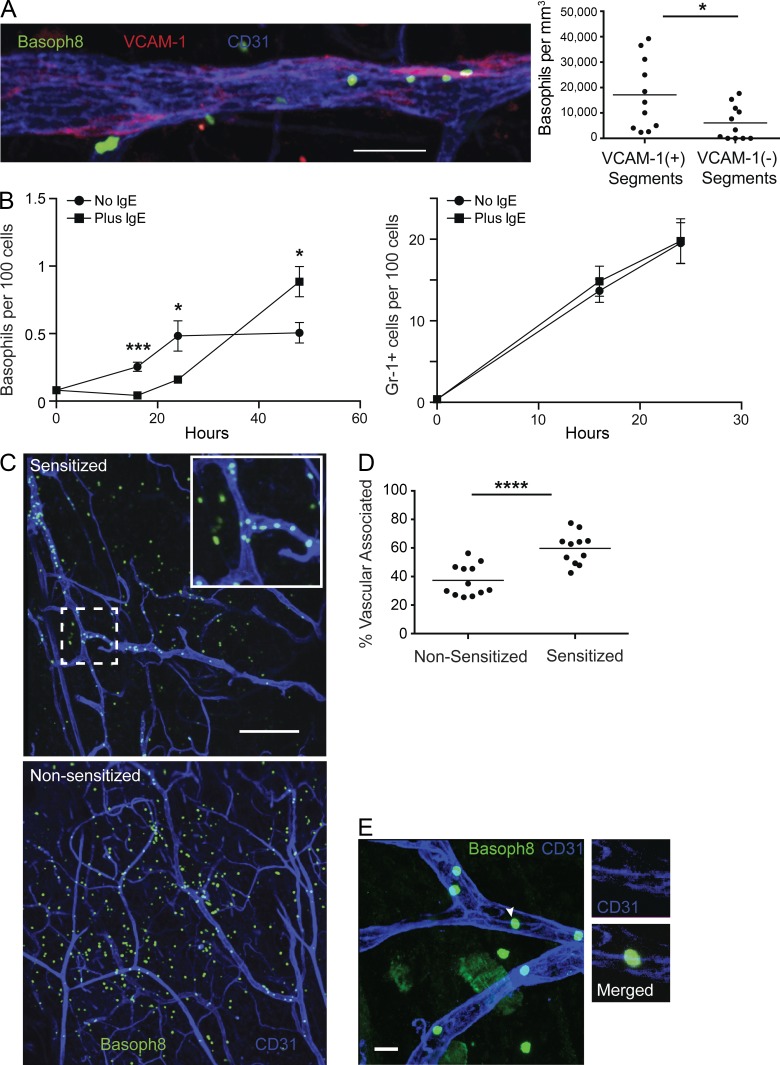
Activated basophils interact with the endothelium. (A, left) Basoph8 mice were sensitized with anti-DNP IgE and, 1 d later, challenged with topical application of DNFB on the ear skin. Approximately 1.5 d after challenge, the mice received conjugated anti-CD31 and anti–VCAM-1 antibody. 10 min after injection, ear skin tissue was harvested and imaged using laser-scanning confocal microscopy. A representative maximum intensity projection of basophils near VCAM-1 patches in CD31-stained endothelium from sensitized, challenged Basoph8 mice is depicted. (right) Quantification of segmented blood vessels is depicted comparing the density of basophils in VCAM-1+ vessel segments with VCAM-1− segments. Each dot represents the density of basophils in segments derived from a single z-stack. Data are pooled from three mice and a total of 11 z-stacks, with a total 10-mm length of blood vessels examined with 55% of the length VCAM+ and 45% VCAM−. (B) Basoph8 mice were sensitized and challenged as in A with anti-DNP IgE. Basophil (left) and Gr-1+ cell (right) accumulation in ear skin was then assessed at the indicated time points. IgE-sensitized mice (squares) were compared with nonsensitized mice (circles) before challenge. Error bars represent SD. Data are representative of two independent experiments with three mice at each time point. (C) Sensitized and nonsensitized Basoph8 mice were challenged with DNFB, and 24 h later, the mice received anti-CD31 conjugated to APC by i.v. injection. Mouse skin was then harvested and mounted 10 min later and imaged as in A. The images represent maximum intensity projections with basophils and CD31+ blood vessels from both sensitized (top) and nonsensitized (bottom) mice. The inset depicts a zoomed-in view of the dashed box. Images are representative of three individual mice for each group with three to four z-stacks taken from each mouse. (D) The images derived from C were further analyzed for vascular-associated versus nonassociated basophils at 24 h after challenge. Each dot represents the percentage of vascular-associated basophils from a single imaging volume for the given condition. (E) Basoph8 mice were treated as in B, and a maximum intensity projection (large panel) of an ear skin whole mount from sensitized Basoph8 mice at 24 h after challenge depicting basophils associated with CD31+ endothelial cell junctions is shown. The white arrowhead denotes a representative basophil associated with CD31 on the endothelium with the individual z-section and corresponding channels highlighted at the right. Image is representative of two independent experiments with at least two mice in each group. Bars: (A) 50 µm; (C) 200 µm; (E) 20 µm. (A, B, and D) Horizontal bars denote mean. P-values were derived from analysis using a two-tailed Student’s t test: *, P < 0.05; ***, P < 0.001; ****, P < 0.0001.

