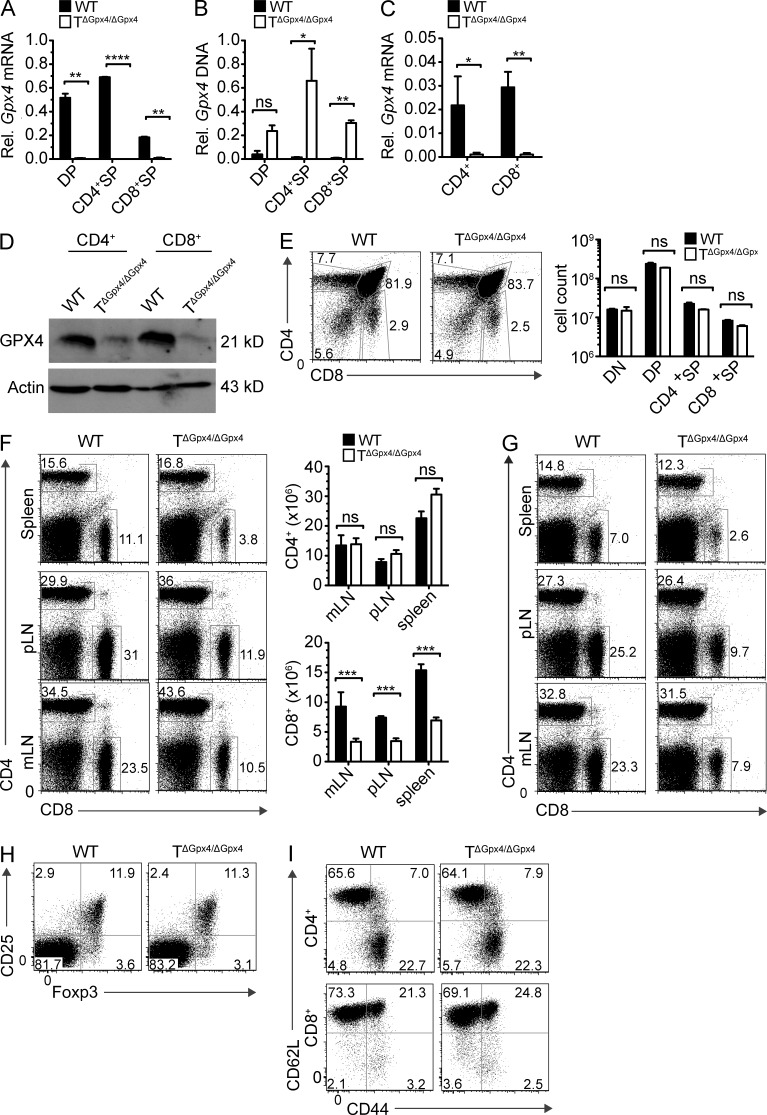
Figure 1.
T specific deletion of Gpx4 leads to normal thymocyte development but defective CD8+ T cell homeostasis in the periphery. (A) Analysis of Gpx4 mRNA in DP, CD4+ SP, or CD8+ SP thymocytes. Results were normalized to G6pdx mRNA. (B) Analysis of genomic Gpx4 DNA in DP, CD4+ SP, or CD8+ SP thymocytes of WT and TΔGpx4/ΔGpx4 mice to determine the presence of the loxP-flanked neomycin resistance gene. Gapdh was used as the housekeeping gene. (C) Real-time PCR analysis of Gpx4 mRNA in peripheral CD4+ or CD8+ splenocytes. Results were normalized to G6pdx mRNA. (D) Western blot of GPX4 expression levels in peripheral CD4+ or CD8+ T cells. Actin was used as a loading control. (E) Representative FACS analysis (left) and absolute number (right) of thymocytes in WT littermate control and TΔGpx4/ΔGpx4 mice. There are no statistically significant differences in the absolute number of CD4−CD8− double negative (DN), CD4+CD8+ DP, CD4+ SP, or CD8+ SP thymocytes (n = 4 mice per group of 6-wk-old mice). (F and G) Flow cytometry analysis of spleen, peripheral LN (pLN), and mesenteric LN (mLN) cells from 6-wk-old (F) and 20-wk-old (G) WT and TΔGpx4/ΔGpx4 mice (left), and absolute numbers (F, right) of CD4+ (top) or CD8+ (bottom) T cells in the spleen (n = 4–5 per group). (H) Analysis of CD4+CD25+Foxp3+ T regulatory cells (T reg cells) in the spleens of WT and TΔGpx4/ΔGpx4 mice (representative plot from n ≤ 4 per group). Flow cytometry plots are pregated on CD4+ subsets. (I) Expression of CD62L and CD44 on WT and TΔGpx4/ΔGpx4 mice splenic T cells. Plots are pregated on CD4+ (top) or CD8+ (bottom; representative plot from n = 3 per group of 6-wk-old mice). *, P ≤ 0.05; **, P ≤ 0.01; ***, P ≤ 0.001; ****, P ≤ 0.0001; ns, not significant (two-tailed Student’s t test). Data are representative of four independent experiments.

