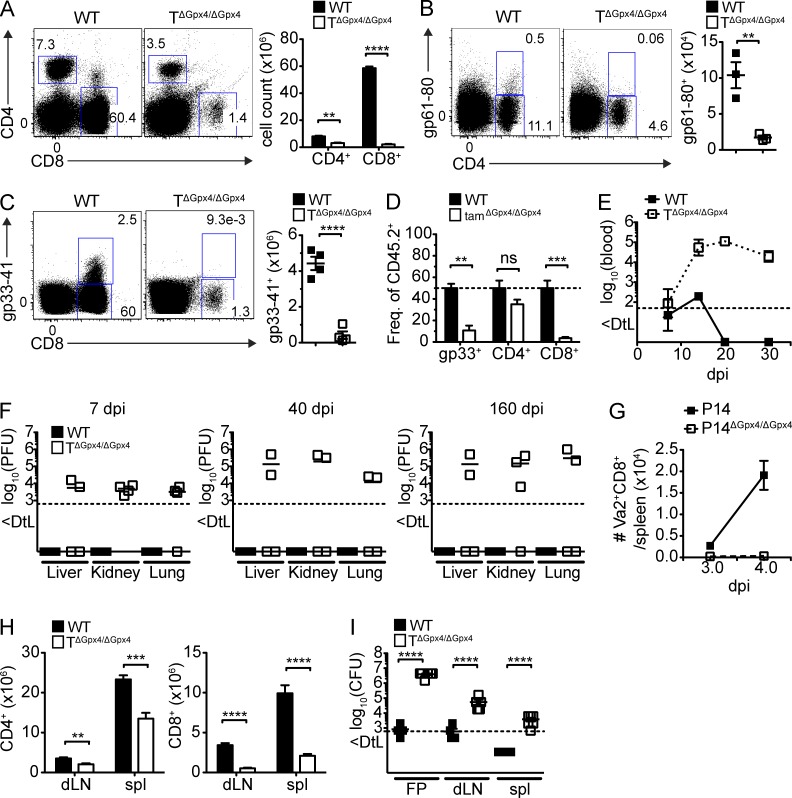
Figure 3.
Gpx4-deficient T cells failed to expand following viral and parasite infection. WT and TΔGpx4/ΔGpx4 mice were infected with LCMV 200 plaque-forming units (pfu) WE i.v. and analyzed on 7 d after infection (dpi). (A) Flow cytometry of CD4+ and CD8+ T cells (left) and total numbers (right; n = 4 per group). (B and C) Flow cytometry (left) and absolute number (right) of gp61-80 tetramer positive CD4+ (B) and gp33-41 tetramer positive CD8+ (C) T cells (n ≥ 4 per group). (D) Frequency of LCMV infected splenocytes from mixed BM chimeras generated by transfer of equal mixture (1:1) of BM stem cells from WT (CD45.1+) and WT or tamΔGpx4/ΔGpx4 (CD45.2+) mice into sublethally irradiated WT (CD45.1+) mice. 8 wk after reconstitution, mice were treated with 2 mg of tamoxifen i.p. for 2 consecutive days, followed by infection with LCMV 200 pfu of WE strain, and analyzed at 10 dpi (n = 3 per group). (E) Viral titers in the blood of infected WT and TΔGpx4/ΔGpx4 mice over time. (F) Viral titers in the liver, lung, and kidney of infected WT and TΔGpx4/ΔGpx4 mice at 7 (left), 40 (middle), and 160 dpi (right; n = 4 per group). (G) Total number of Vα2+CD8+ T cells of WT (CD45.1+) and P14ΔGpx4/ΔGpx4 (CD45.2+) mice that were adoptively transferred into WT (CD45.1+CD45.2+) mice and infected with LCMV-WE (1000 pfu) 2 h after transfer. Mice were analyzed at 3 and 4 dpi (n = 5 per group). (H and I) WT and TΔGpx4/ΔGpx4 mice were inoculated with 2 × 10⁶ L. major stationary-phase promastigotes into the right hind footpad and analyzed at 10 wk after infection. Total number of CD4+ (left) and CD8+ (right) T cell in the draining LN (dLN), and spleen (spl; H). Parasite load in infected footpad (FP), dLN, and spleen were measured by limiting dilution analysis (I). Dotted line represents the limit of detection (DtL; n = 6 per group). Statistical significance is defined by Student’s t test (**, P ≤ 0.01; ***, P ≤ 0.001; ****, P ≤ 0.0001). Representative data are shown from four (A–C, E, and F), three (G), and two (D, H, and I) independent experiments.

