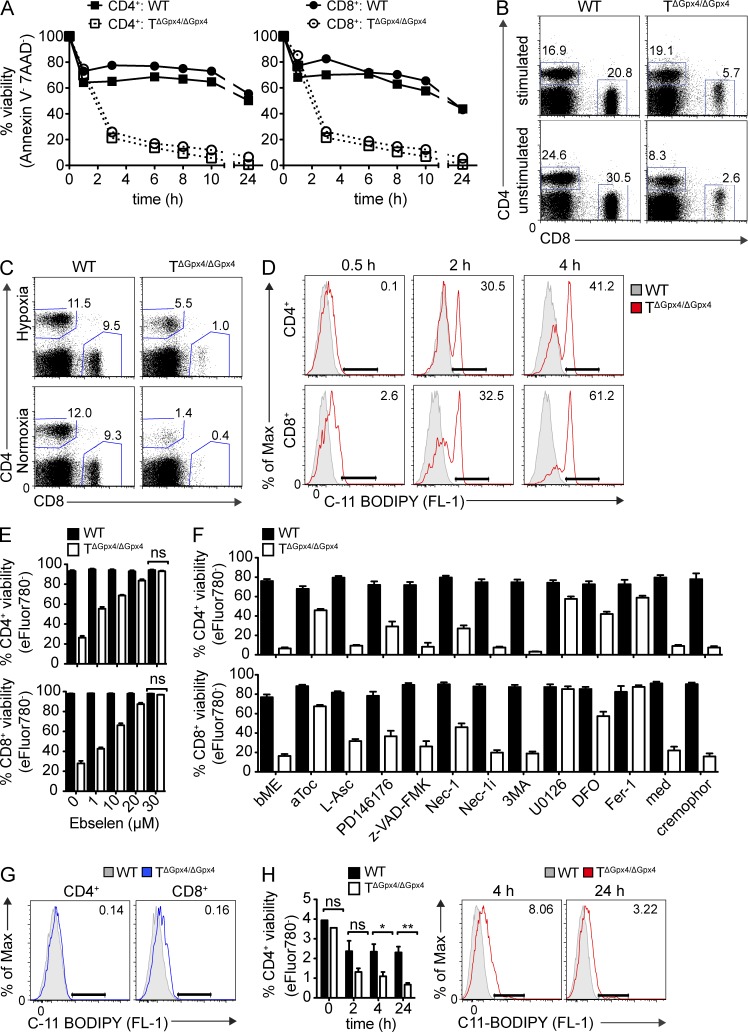
Figure 4.
Gpx4-deficient T cells rapidly accumulate lipid peroxides and die by ferroptosis. (A) Frequencies of viability of CD4+ and CD8+ T cells from the LNs defined by Annexin V− and 7AAD− cells over time under stimulation with α-CD3 (5 µg/ml) and α-CD28 (2 µg/ml; left) or unstimulated (right) conditions (n = 3 per group). (B) Flow cytometry of viable CD4+ and CD8+ T cells LN cells distinguished by Annexin V−7AAD− (pregated) population after 4 h of culture at 37°C. Cells were stimulated with α-CD3 (5 µg/ml) and α-CD28 (2 µg/ml; top) or unstimulated (bottom) in the presence of IL-2 (20 ng/ml; n = 3 per group). (C) Flow cytometry of splenic CD4+ and CD8+ T cells cultured under normoxic (21% O2) or hypoxic (1% O2) conditions for 5 h at 37°C (n = 4 per group). (D) Accumulation of lipid peroxidation in CD4+ and CD8+ T cells determined by C11-BODIPY581/591 (2 µM) at 0.5, 2, and 4 h after incubation at 37°C (n = 3 per group). (E) Percent viability of stimulated CD4+ (left) and CD8+ (right) splenic T cells after 4 h at 37°C with various concentrations of ebselen (n = 3 per group). (F) Frequencies of viable (eFluor780−) splenic CD4+- (left) and CD8+-stimulated (right) T cells treated with antioxidants or cell death pathway inhibitors for 24 h at 37°C (n = 4 per group). (G) C11-BODIPY581/591 (FL-1) accumulation in stimulated CD4+ and CD8+ T cells, treated with ferrostatin-1 (Fer-1; 10 µM) for 4 h (n = 3 per group). (H) Total number of splenic CD4+ T cells at 0, 2, 4, and 24 h after intravenous injection of α-CD3 antibody (1 µg; left) and lipid peroxidation assessed by C11-BODIPY581/591 at 4 and 24 h after injection (right; n = 3 per group). The data are representative of at least five (A, B, and F), three (D, E, and G), and two (H) independent experiments. Statistical significance is defined by Student’s t test (*, P ≤ 0.1; **, P ≤ 0.01).

