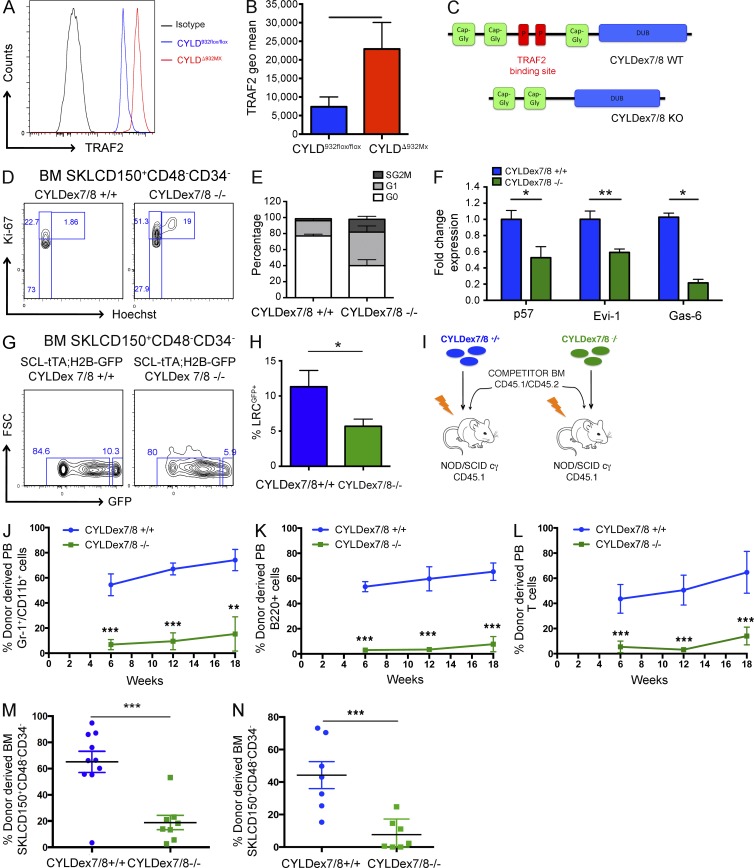
Figure 3.
CYLD interaction with TRAF2 is crucial to preserve HSC dormancy. (A and B) TRAF2 expression determined by flow cytometry in BM HSCs isolated from CYLD932flox/flox and CYLDΔ932Mx mice. (C) Scheme showing normal CYLD and the CYLDex7/8 mutant protein. (D and E) Cell cycle analysis by flow cytometry of BM HSCs isolated from control and CYLDex7/8−/− mice. (F) mRNA expression levels of dormancy-associated genes determined by qRT-PCR of FACS-sorted HSCs from control and CYLDex7/8−/− mice. (G and H) Label-retaining assays using SCL-tTA;H2B-GFP;CYLDex7/8+/+ (control) and SCL-tTA;H2B-GFP;CYLDex7/8−/− (experimental) mice. Percentage of LRCs was determined by flow cytometry. (I) Experimental scheme for the generation of BM chimeras (i.v.) used for the analysis shown in J–M. (J–M) Donor-derived level of myeloid (J), B cell (K), and T cell (L) chimerism in the peripheral blood (6, 12, and 18 wk after transplant), as well as BM of recipient mice (18 wk after transplant) analyzed for HSCs (M). (L) Same analysis as shown in E, but transplantation was performed by intrafemoral injection. Donor-derived HSC chimerism in the BM of recipients was analyzed 18 wk after transplant. (N) Same analysis as shown in I, but transplantation was performed by intrafemoral injection. Donor-derived HSC chimerism in the BM of recipients is shown 18 wk after transplant. Results are shown of two (F: 6/4; J–M: 10/8; N: 7/7) or three (A and B: 7/8; D and E: 10/8; G and H: 5/7) independent experiments, with the numbers of analyzed control/mutant mice indicated in parentheses. Error bars indicate SEM. *, P < 0.05; **, P < 0.01; ***, P < 0.001.

