Figure 6.
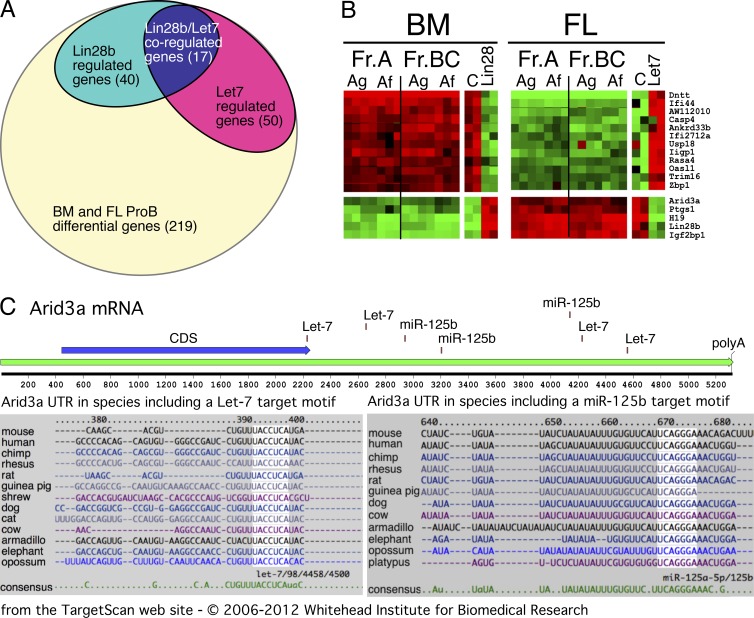
Analysis of mRNAs regulated by the Lin28b–Let-7 axis in pro-B cells identified Arid3a as a key regulator of B cell fate. (A) Venn diagram illustrating the identification of a set of 17 genes whose expression is perturbed reciprocally by alteration of Lin28b–Let-7 in pro-B stage cells. BM pro-B cells sorted from BALB/c mice were transduced after 1 d in culture with either Lin28b or empty vector retrovirus and then cultured an additional 4 d and finally sorted as CD19+GFP+ cells. FL pro-B cells from the same strain were treated similarly, except that transduction was with Let-7b or empty retrovirus and cells were sorted as CD19+GFP+ (results are incorporated from B). (B) Heat map of mRNA expression fold change perturbations (relative to control-transduced samples) induced by retroviral transduction of Lin28b–Let-7b (as diagrammed in A). Two samples representative of expression changes in each cell type are shown. For BM cells, genes normally high (red) switch to green, whereas those normally low (green) switch to red (left). A reciprocal change is seen with FL cells (right). Data from unperturbed pre-pro-B (Fr. A) and pro-B (Fr. BC) microarray analysis of FL and BM, using both the Agilent (Ag) and Affymetrix (Af) platforms, are included for comparison. Results are representative of two independent experiments. (C) ARID3a, one of the genes whose expression was increased by Lin28b and decreased by Let-7 miRNA, has Let-7 and miR-125b target seed sites in its 3′-UTR. The Arid3a diagram was produced in MacVector, and species alignments were obtained from the TargetScan website, Whitehead Institute for Biomedical Research.

