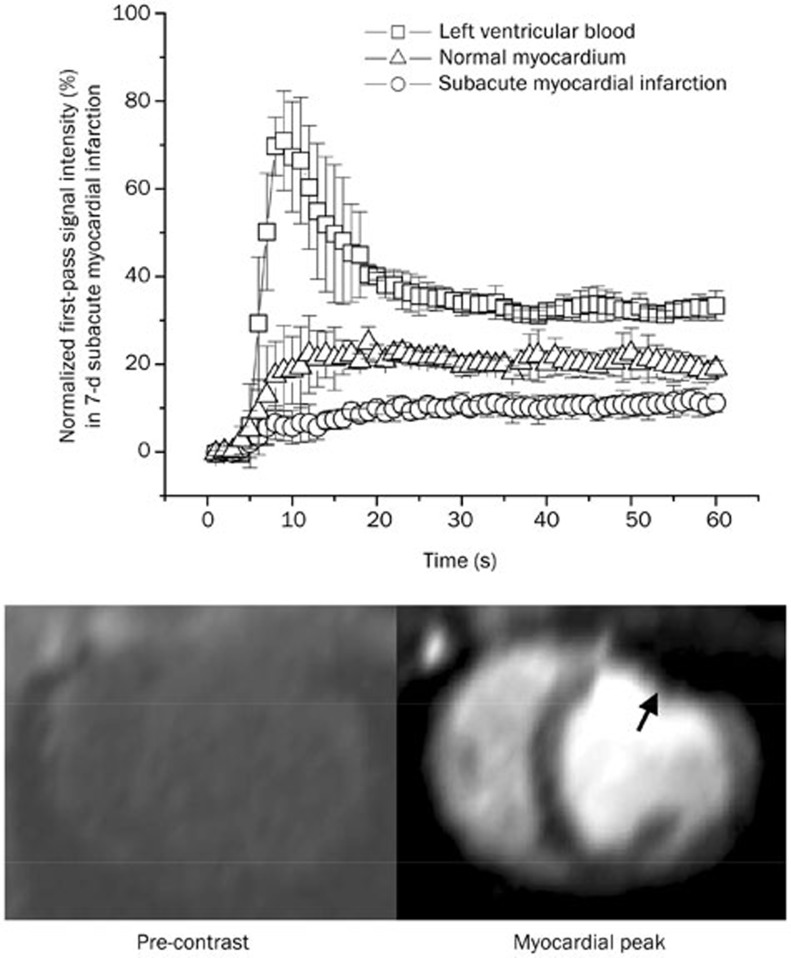
Figure 4.
Time intensity curves and representative images of the first-pass perfusion MRI in subacute myocardial infarction. The first-pass signal intensity in subacute infarction had a degree of elevation that was still lower than that in the normal myocardium. Therefore, the subacute myocardial infarction was identified as a region of hypoenhancement on first-pass perfusion MRI (arrowheads, lower panel).

