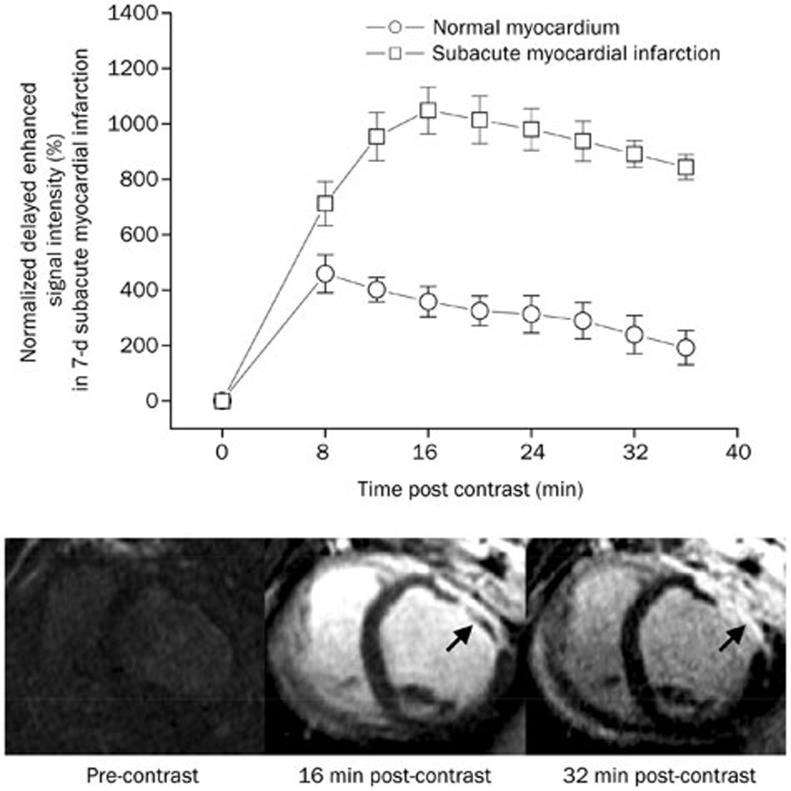
Figure 5.
Time intensity curves and representative images of delayed enhancement MRI in subacute myocardial infarction. The delayed enhancement signal intensity in the subacute infarction was significantly higher than that in the normal myocardium (upper panel). The infarcted epicardium displayed an earlier hyperenhancement than the infarcted endocardium. The infarcted epicardium acquired hyperenhancement at 16 min post-contrast, while transmural hyperenhancement was ultimately observed at 32 min post-contrast (arrowheads, lower panel).

