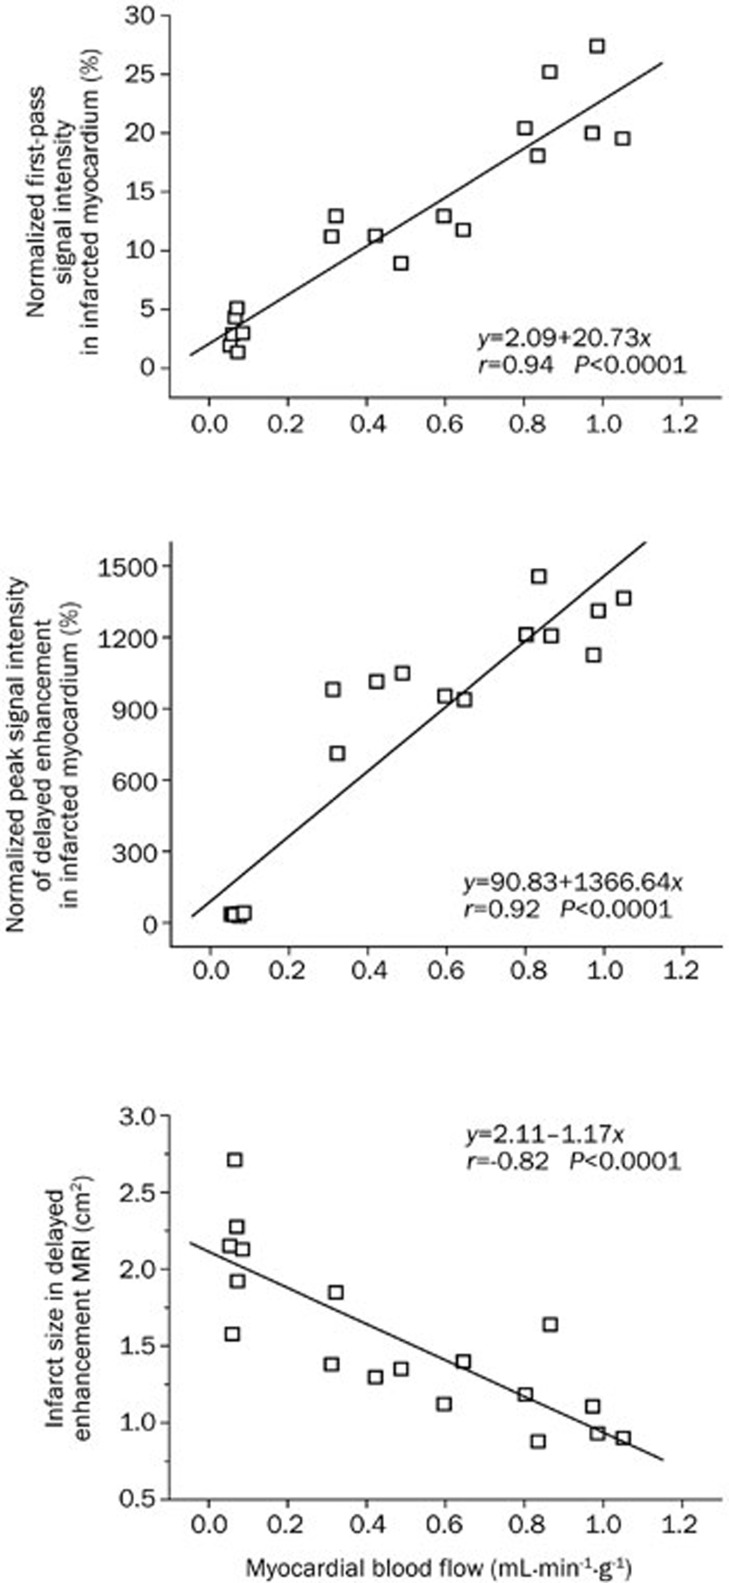
Figure 8.
Correlations between the myocardial blood flows and peak MR signal intensities or infarct sizes. The regional myocardial blood flows, infarct sizes and MR signal intensities were obtained in the three stages of myocardial infarctions. A strong correlation between the regional blood flow and peak signal intensity was noted in the infarcted myocardium for both first-pass perfusion MRI (r=0.94, P<0.01) (top panel) and delayed enhancement MRI (r=0.92, P<0.01) (middle panel). Moreover, regional myocardial blood flows were negatively correlated with the infarct areas of the pig hearts (r=−0.82, P<0.01) (bottom panel).

