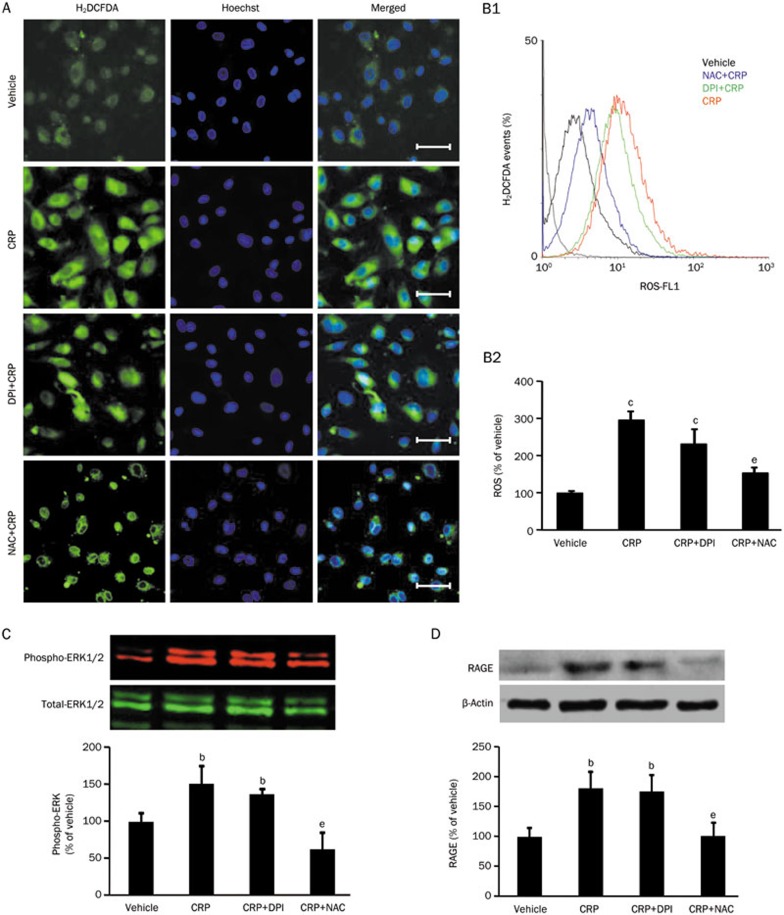
Figure 1.
Effects of ROS or NADPH inhibitor on CRP-induced ROS production, RAGE expression and ERK phosphorylation in HCAECs. (A) Representative 2′,7′-dichlorodihydrofluorescein diacetate (H2DCFDA, a general ROS indicator) under a fluorescent microscope (Scale bar: 50 μm). (B1) Representative flow cytometer analyses of ROS production in HCAECs treated with vehicle, CRP, diphenyleneiodonium (DPI, a NADPH oxidase inhibitor) with CRP or N-acetyl-L-cysteine (NAC, a general ROS inhibitor) with CRP; (B2) Summarized fluorescence intensity of 20 000 cells for each group. (C) Western blot analysis of phospho-ERK1/2 expression in HCAECs. (D) Western blot analysis of RAGE expression in HCAECs. Data are represented as the mean±SEM (n=3–6). bP<0.05, cP<0.01 vs vehicle. eP<0.05 vs CRP.

