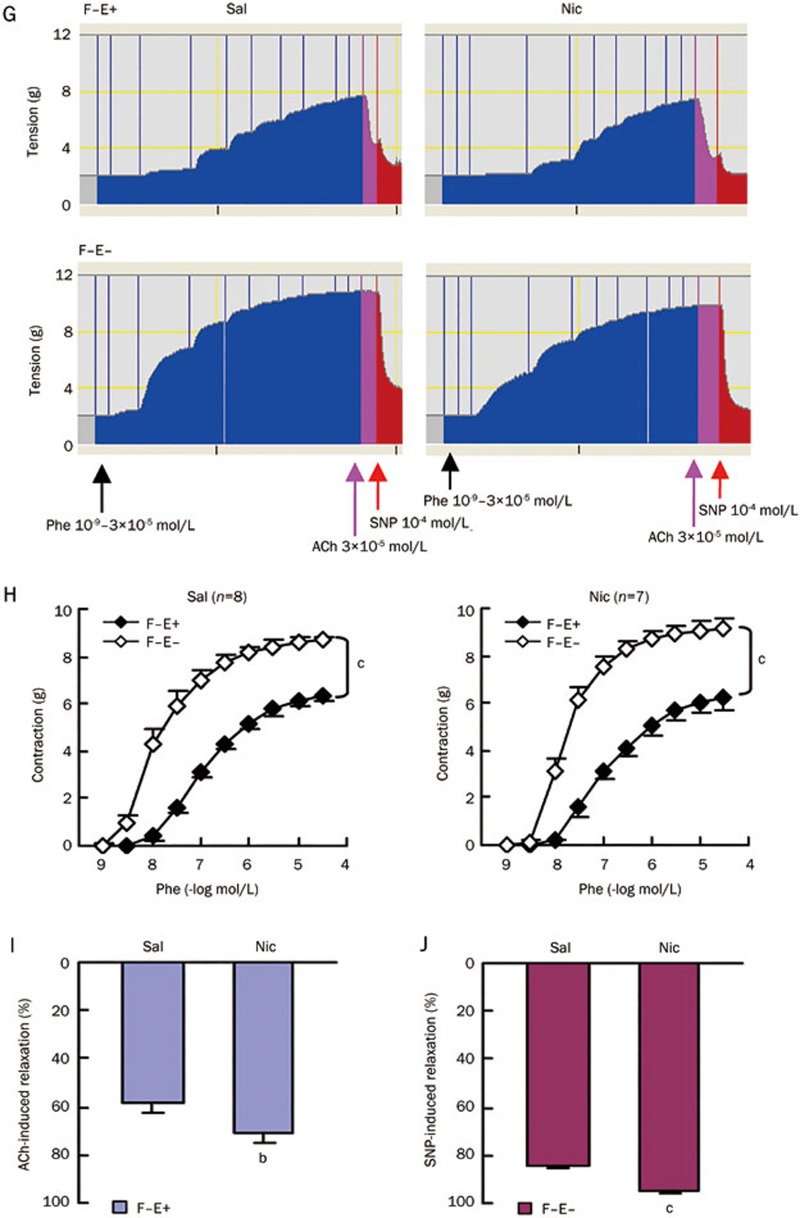
Figure 2G-2J.
(G) Representative recordings for Phe-induced aortic pre-contraction and subsequent responses to a single dose of ACh and sodium nitroprusside (SNP). Dose-response curve of Phe-induced aortic pre-contraction (H) and subsequent aortic relaxation induced by a single dose of ACh (3×10⁻⁶ mol/L) (I) and SNP (10−4 mol/L) (J) successively. Sal, saline group; Nic, nicotine group; F−E+, adventitial fat removed and endothelium intact; F−E−, both adventitial fat and endothelium removed. Data are shown as mean±SEM. bP<0.05, cP<0.01.

