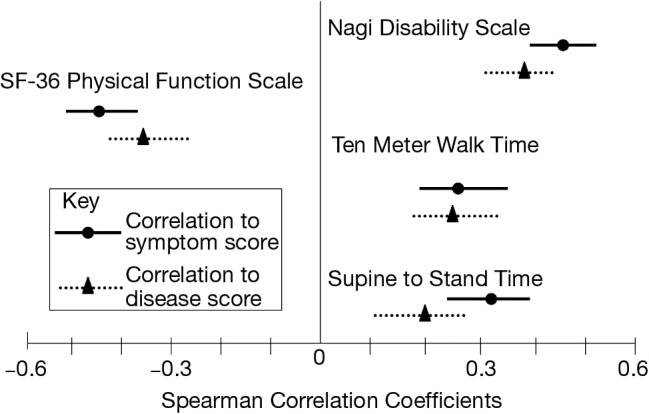
Figure 4.

Reproduced from the article of Whitson et al. (J Am Geriatr Soc 2009). Graphical comparison of the strength of correlation between measures of mobility function and scores verses measures of mobility function and disease scores. The center line indicates a correlation of zero. Points further from the center indicate a stronger correlation. Solid and dotted lines indicate the 95% confidence intervals. The Spearman correlation coefficient for Nagi Disability scale to symptom score is 0.435 (0.355 to 0.509) and to disease score 0.349 (0.262 to 0.429). The Spearman correlation coefficient for Ten Meter Walk time to symptom score is 0.273 (0.186 to 0.356) and to the disease score 0.260 (0.173 to 0.344). The Spearman correlation coefficient for Supine to Stand time to symptom score is 0.311 (0.225 to 0.392) and to disease score 0.201 (0.111 to 0.288). The Spearman correlation coefficient for SF-36 Physical Functioning Scale to symptom score is −0.442 (−0.512 to −0.365) and to disease score −0.349 (−0.427 to 0.266). NB: Higher scores on the SF-36 Physical Functioning Scale indicate higher functioning, whereas higher scores on the other three mobility function measures indicate lower functioning.
