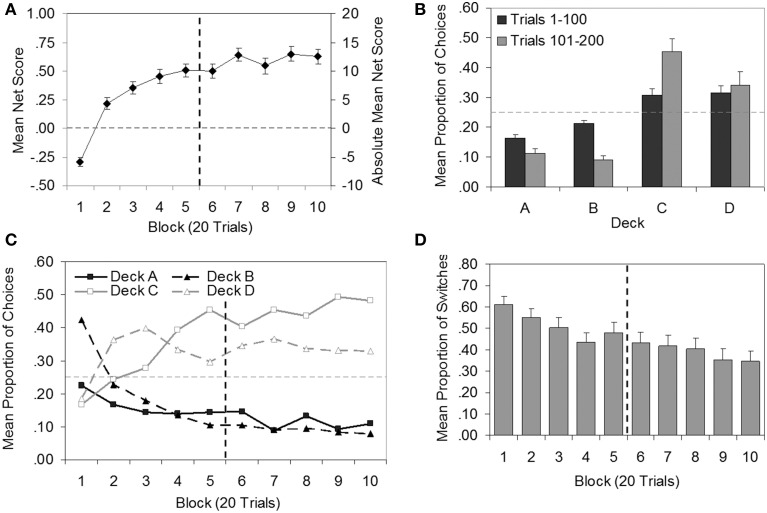
Figure 3.
Plots of group data (N = 50) for the Iowa Gambling Task. (A) Mean net score by block (secondary axis displays absolute mean net score for comparison with previous literature). (B) Mean proportion of choices by deck for each 100-trial epoch. (C) Mean proportion of choices by block for each deck (error bars omitted for clarity). (D) Mean proportion of switches by block. Error bars show standard error of the mean. Vertical dashed line demarcates trials 1–100 and 101–200, where relevant. Horizontal dashed line indicates the level at which the number of choices from bad decks was equal to the number of choices from good decks (A), or chance selection (B,C).

