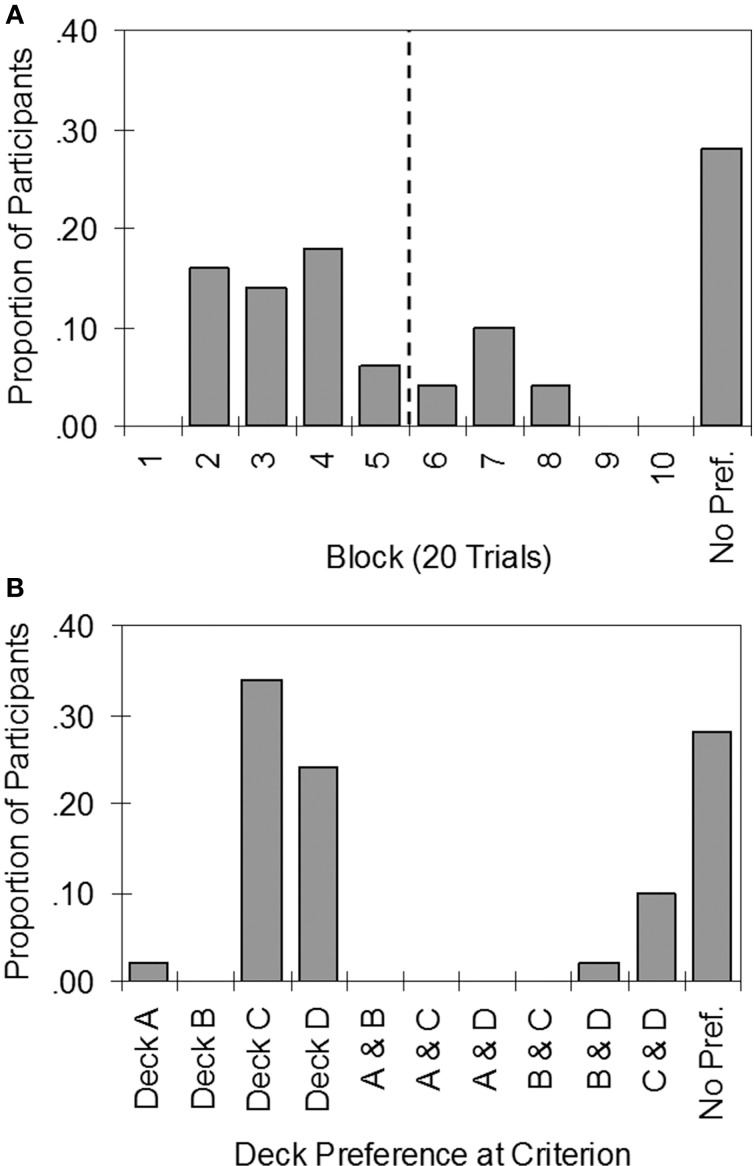
Figure 4.
Histograms summarizing the results of applying the stability criterion to individual data in the Iowa Gambling Task. (A) Proportion of participants to reach the stability criterion by each block of trials (vertical dashed line demarcates trials 1–100 and 101–200). (B) Proportion of participants who preferred each deck or pair of decks. No Pref., No preference by the end of the task.

