
Figure 1.
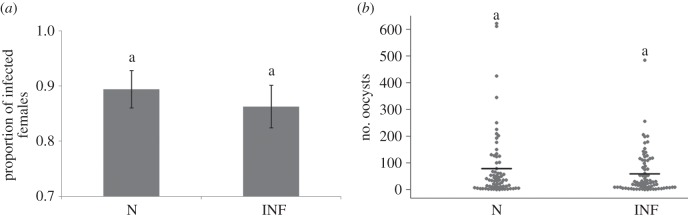
Effect of the infection status of the maternal (F0) generation on the (a) infection prevalence and (b) oocyst burden in the F1 offspring. (a) Mean (±s.e.) proportion of females infected; (b) number (dots) and median number (horizontal line) of oocysts. N, uninfected mothers; INF, infected mothers.