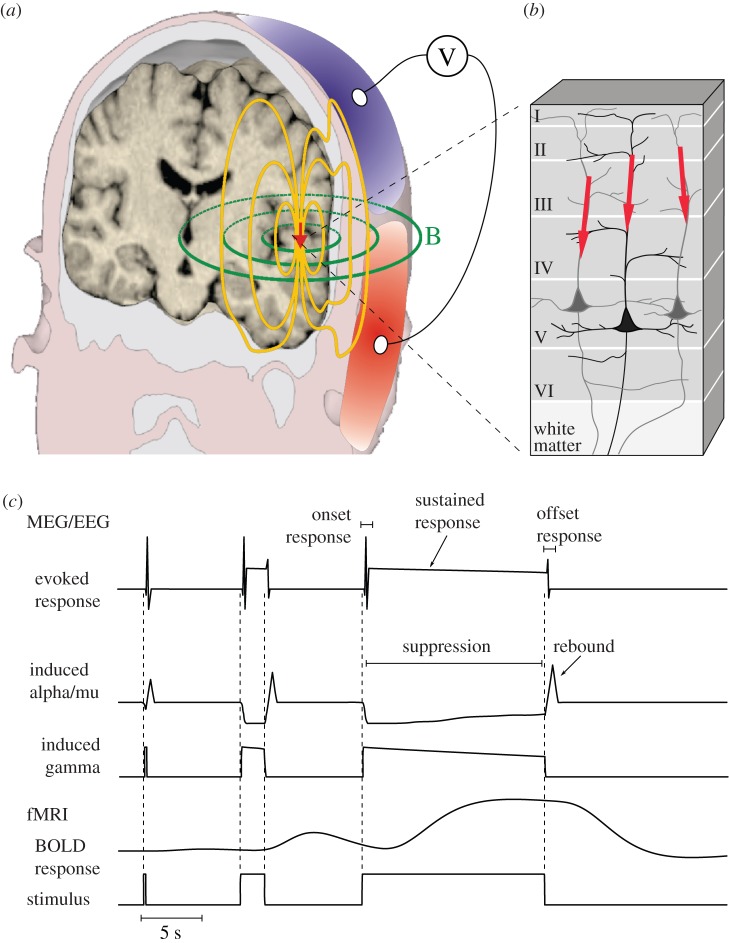
Figure 1.
Genesis of EEG and MEG signals. (a) Electric currents (red arrow) in active neurons drive volume currents (yellow lines) within the head, which gives rise to a potential distribution (V) on the scalp. The currents also generate a magnetic field (green lines; B) outside of the head; here the direction of the magnetic field follows (according to the right-hand rule) the direction of the net intracellular currents. (b) The main contribution to EEG and MEG signals comes from post-synaptic currents (red arrows) in the apical dendrites of pyramidal neurons. (c) A highly schematic illustration of electrophysiological (MEG/EEG) and haemodynamic (fMRI) response time courses to stimuli of three different durations. Evoked responses are phase-locked to the stimuli while induced responses reflect amplitude changes in the non-phase-locked oscillatory brain activity.

