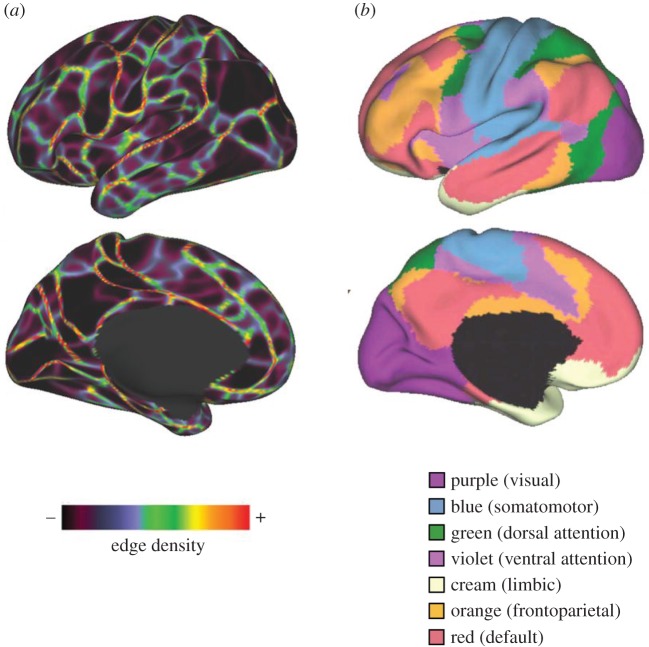
Figure 2.
Parcellation and network community detection. (a) A boundary map derived from group-averaged (n = 160) resting-state functional connectivity. ‘Hot colours’ (red/yellow) in edge density mark locations on the cortical surface where patterns of functional connections exhibit abrupt changes, corresponding to boundaries between relatively homogeneous (black/blue/purple) regions. (Adapted with permission from Gordon et al. [61].) (b) A network map of the cerebral cortex derived by clustering resting-state functional connectivity measured in a large number of participants (n = 1000) into seven network communities. These communities correspond to several well-studied resting-state or intrinsic connectivity networks. (Adapted with permission from Yeo et al. [62].)

