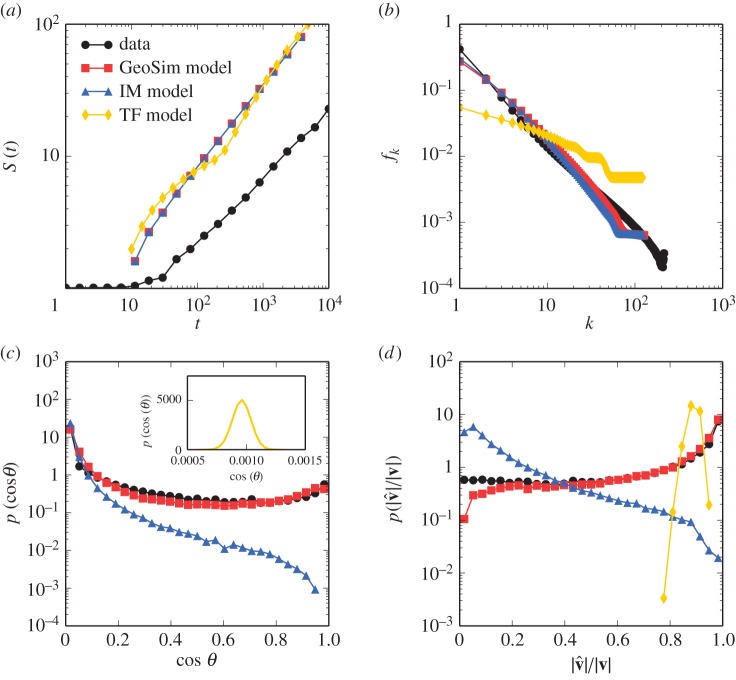
Figure 6.
Comparing social mobility models. (a) We compare model results simulating the rate of exploration S(t) compared with empirical data. While all three models appear to estimate more absolute locations visited, the rate of this growth is consistent between them and in line with data. (b) For each user, we sort locations based on the number visits and compute the frequency that a user visits a location of rank k. We find that the IM model and our extension to it reproduce this distribution well, whereas the TF model is much flatter, distributing visits more evenly over all locations. (c) Only the GeoSim model is able to reproduce patterns of mobility similarity and (d) predictability. The TF model results shown in the inset in (c) show similarity values orders of magnitude below the observed data. As the similarity is heavily influenced by the frequency distribution of visits, this deviation is likely owing to the flatter distribution of fk produced by the TF model.

