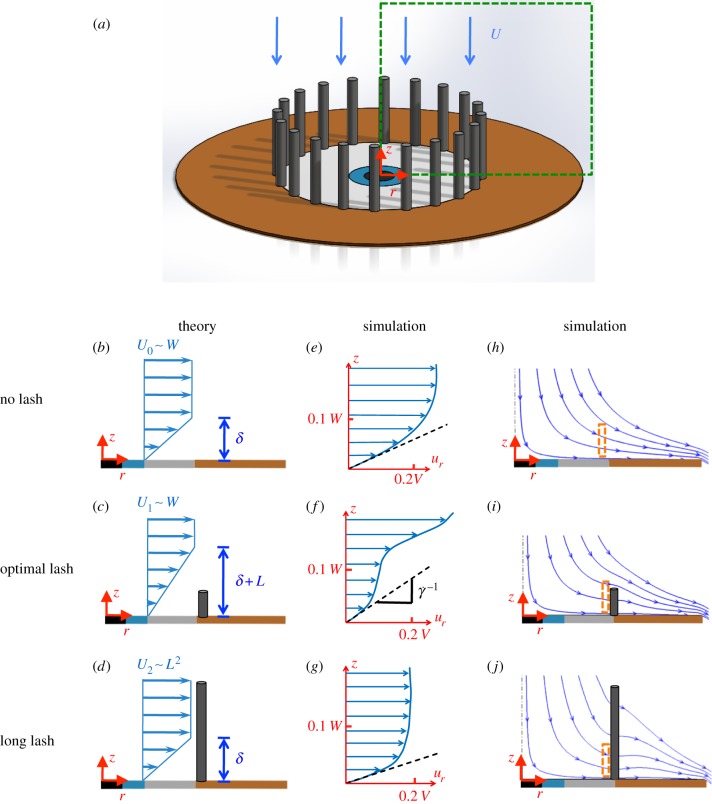
Figure 7.
Velocity near the eye. (a) Dashed box shows cross section of flow from which velocity is shown. Columns show both theoretical (b–d) and (e–g) numerical predictions for the radial velocity ur distribution along the height z above the ocular surface. (h–j) The final column shows numerical predictions for streamlines. The dashed box shows the location of the velocity profiles in (e–g). Rows represent the three cases: no lashes, optimal lashes and long lashes. (Online version in colour.)

