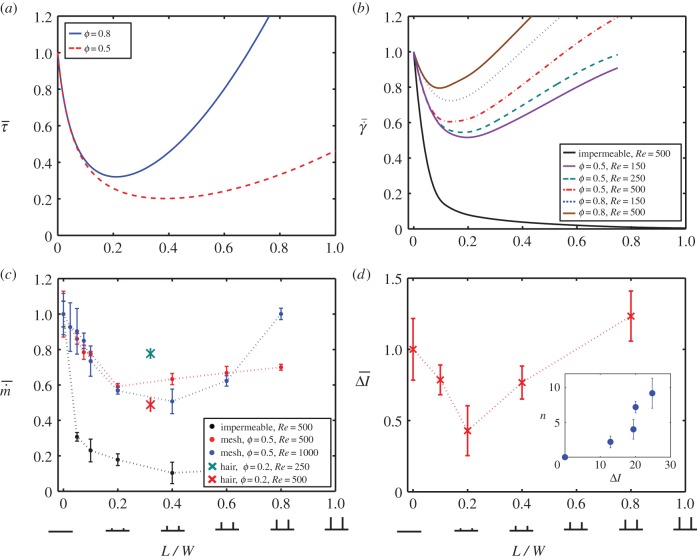
Figure 8.
(a) Shear stress  , (b) shear rate
  , (c) evaporation rate
  , and (d) change in fluorescence intensity
  , all versus eyelash length L/W. All values reported are normalized with their respective values for an eye with no lashes. (d) Inset shows relationship between number of deposited drops n in drops mm−2 and change in fluorescence intensity ΔI. (Online version in colour.)

