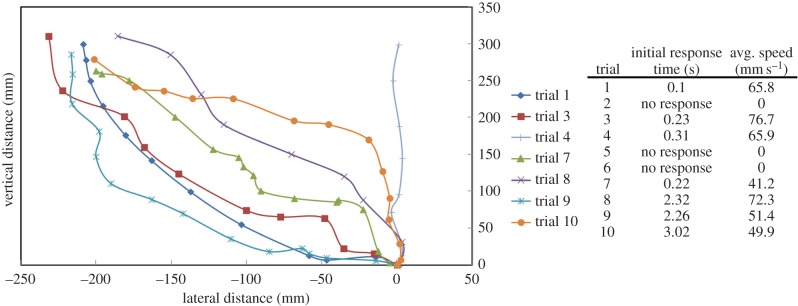
Figure 6.

Plot of left paths taken for one roach (R1) over 10 trials. Initial response time to stimulation, and average speed for each trial are tabulated to the right. For trial 4, control was considered a failure as a left turn was not initiated. (Online version in colour.)
