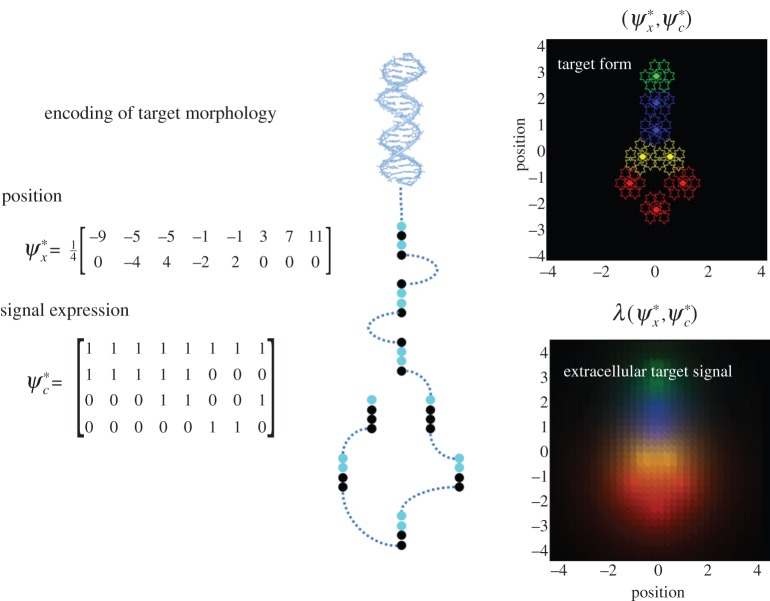
Figure 2.
Target morphology. The right panels show the encoding of target locations (upper left) and cell type (lower left). This encoding can be regarded as a genetic code specifying the chemotactic signals expressed by each cell, which is associated with a specific—possibly place coded—location. In other words, the intracellular location of the code may encode the extracellular location, as indicated in the schematic (middle panel) associating signal expression with binary codons. The corresponding configuration is shown in the upper right panel, where the last three signal expressions are used to differentiate cells (using a red–green–blue colour scheme). The locations of the eight clones are shown with filled stars. The lower right panel shows the target concentrations that would be sensed at each location under this target configuration. (Online version in colour.)

