
Figure 8.
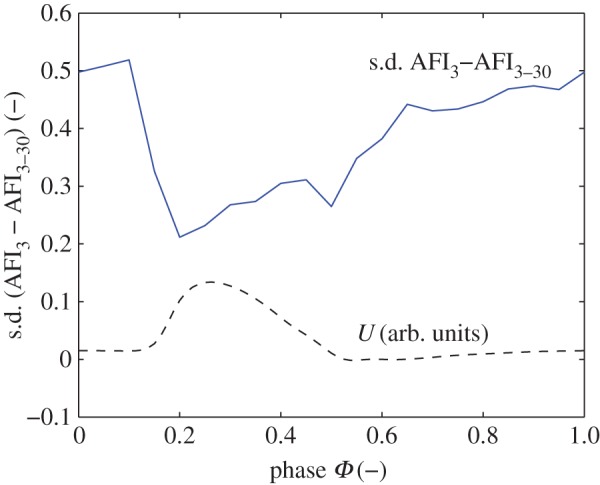
The difference in AFI in the AAA using either cycle 3 or cycles 3–30. Shown is the standard deviation of the local differences, throughout the cardiac cycle. The inflow conditions are shown as reference (dashed line) in arbitrary units. (Online version in colour.)