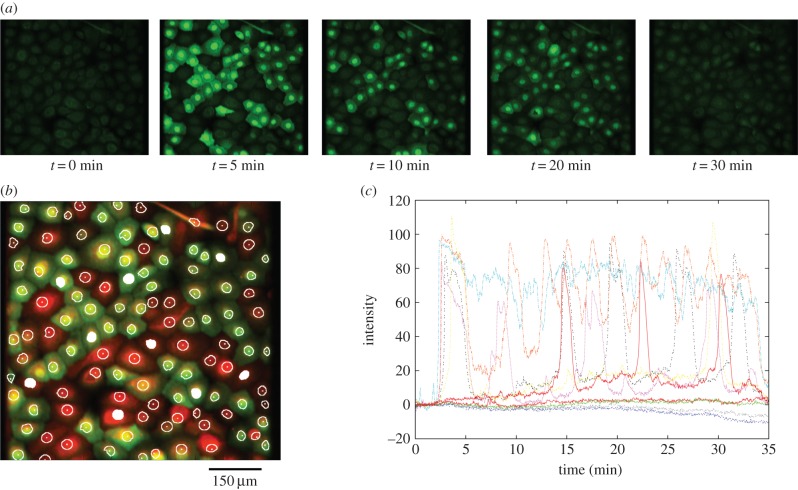
Figure 2.
Calcium transients triggered by the application of the purinergic agonist ATP to the urothelial cell monolayer. (a) Time-lapse fluorescence microscopy images of the urothelial cell monolayer using a ×20 objective. (b) Segmentation of cells to identify 114 ROIs. (c) Calcium transients obtained from 10 representative cells after segmentation of the image using the ROI algorithm (indicated by the white-filled ROIs in b). These were selected to illustrate the variability in the responses observed, including bursting, spiking and extended plateaus. Colours are arbitrary and for visual clarity. Intensity is in arbitrary units.

