Figure 3.
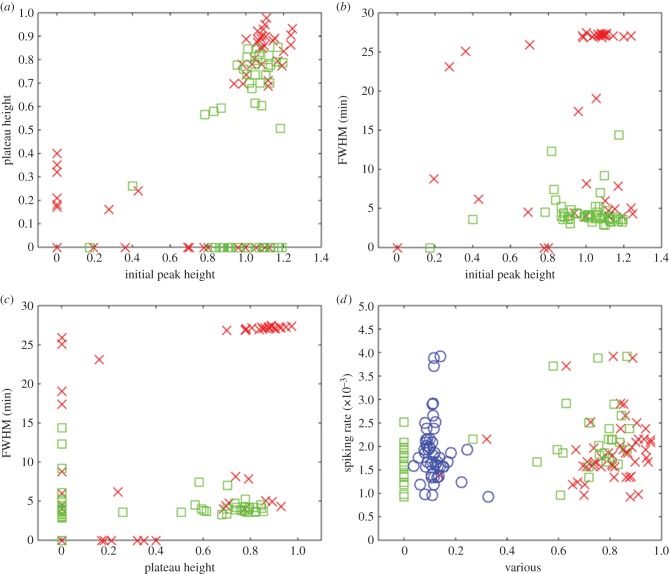
Detailed analysis of the calcium transients recorded during exposure of cells to exogenous ATP. (a) Initial peak height versus plateau height for cells (both in arbitrary units) which subsequently did not enter a spiking mode (red, ×) and those which did (green, □). Three clusters were identified. Small initial peaks only produced shallow plateaus. A larger initial peak can lead to one of two behaviours: a shallow plateau followed by spiking, or a higher plateau that tends to be stable. (b) Initial peak height (in arbitrary units) versus FWHM (which indicates the plateau duration) for the same population of cells. Again, we can identify three separate clusters. Small initial peaks produce short plateaus. A larger initial peak leads to two clearly separated groups: those with an extended plateau that do not subsequently start spiking, and those with a short plateau that subsequently give way to spiking. (c) Plateau height (in arbitrary units) versus FWHM. Contrast non-spiking cells, which tend to have a long, high plateaus compared to spiking cells, which have a continuous spread of plateau heights but of much shorter duration. (d) Initial peak height (red, ×), plateau height (green, □), and FWHM (blue, ○) versus spiking rate (in s−1), for cells which subsequently entered a spiking or bursting mode. There is no obvious relationship between any of these features and the subsequent spiking or bursting rate. Note that in each case the abscissa has been scaled so that the data points lie between 0 and 1.

