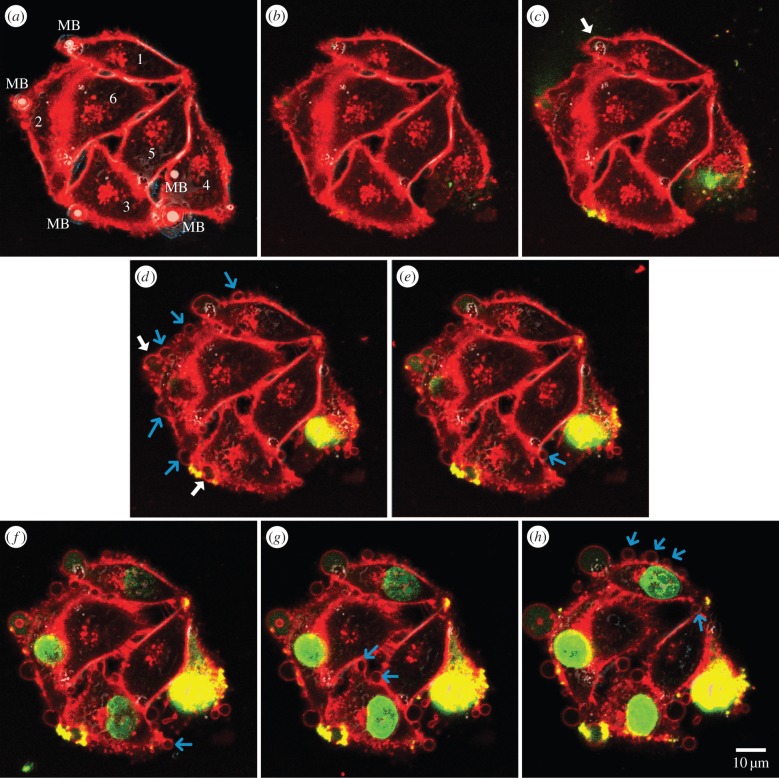
Figure 2.
Confocal image set of a six-cell scenario showing membrane blebbing at resealed sonoporation sites (see also electronic supplementary material, movie S1). Cells 1–3 (reversibly sonoporated): one microbubble (MB) attached to their membrane before exposure. Cell 4 (irreversibly sonoporated): two MBs bound before exposure. Cells 5, 6 (unsonoporated): no MB attachment. Image frames are shown for different time points (in mm : ss scale): (a) 00 : 00 (just before ultrasound pulsing); (b) 00 : 01 (first frame after exposure); (c) 00 : 10; (d) 01 : 20; (e) 03 : 00; (f) 06 : 30; (g) 10 : 00; (h) 15 : 00. White and light-blue arrows highlight the first instant in which a bleb had formed at, respectively, the sonoporation site and other places along the membrane. Red and green labels, respectively, show plasma membrane (CellMask) and sonoporation tracer (Sytox Green). They were merged with the corresponding bright field image which depicts the pre-exposure microbubble location.

