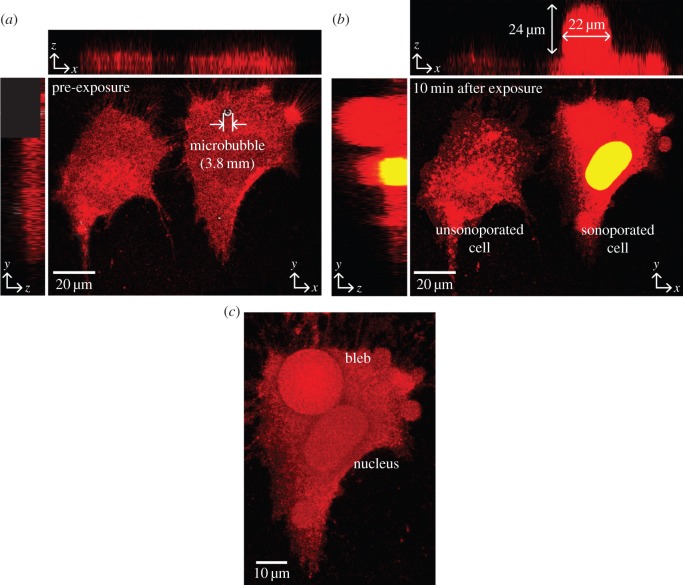
Figure 4.
Three-dimensional confocal rendering of plasma membrane (red) blebbing due to microbubble-mediated sonoporation. Maximum intensity projection images along three planes (xy, xz and yz) are shown (a) before and (b) 10 min after sonoporation for two cells: an unsonoporated cell (left) and a cell sonoporated by ultrasound-triggered microbubble collapse (right). Sytox-Green was used as tracer to label the sonoporated cell (giving yellow cytoplasmic fluorescence when merged with red membrane colour). (c) Volumetric rendering of the membrane bleb at the sonoporation site (top-down view). The bleb occupied a significant volume of the sonoporated cell.

